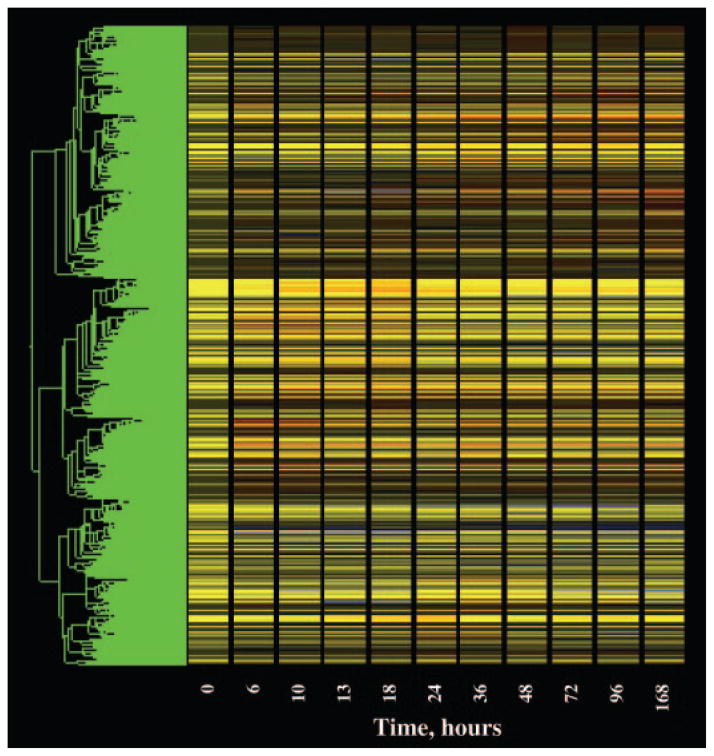
Fig. 1.
Gene tree representation of all probe sets (15,967) on individual Affymetrix R230A gene chips hybridized to total RNA prepared from livers taken from animals treated chronically with MPL (0.3 mg/kg·h) for periods ranging from 6 –168 h. The values for each individual probe set at each time point were normalized to the mean value of that probe set for time zero controls. The x-axis represents the 11 time points, including time zero controls. The y-axis presents the list of probe sets grouped by similarity using Pearson’s correlation. Yellow indicates no change from controls, red indicates probe sets with enhanced expression relative to controls, and blue indicates suppressed expression relative to controls.

