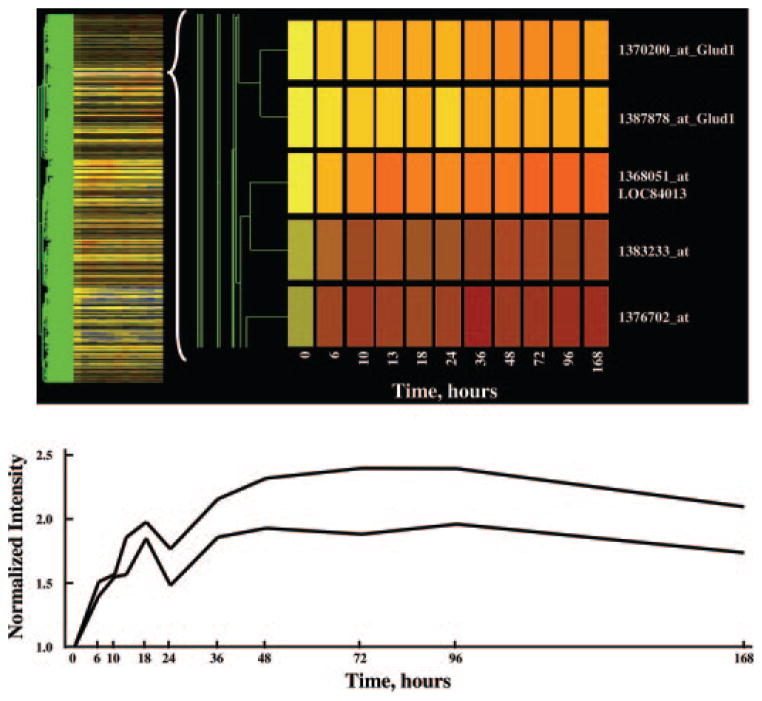
Fig. 2.
The top panel provides a magnification of five probe sets selected from Fig. 1 that show apparent enhanced regulation by MPL. Two of these probe sets represent the same gene (Glud1). The linear plots for both Glud1 probe sets are presented in the lower panel.

