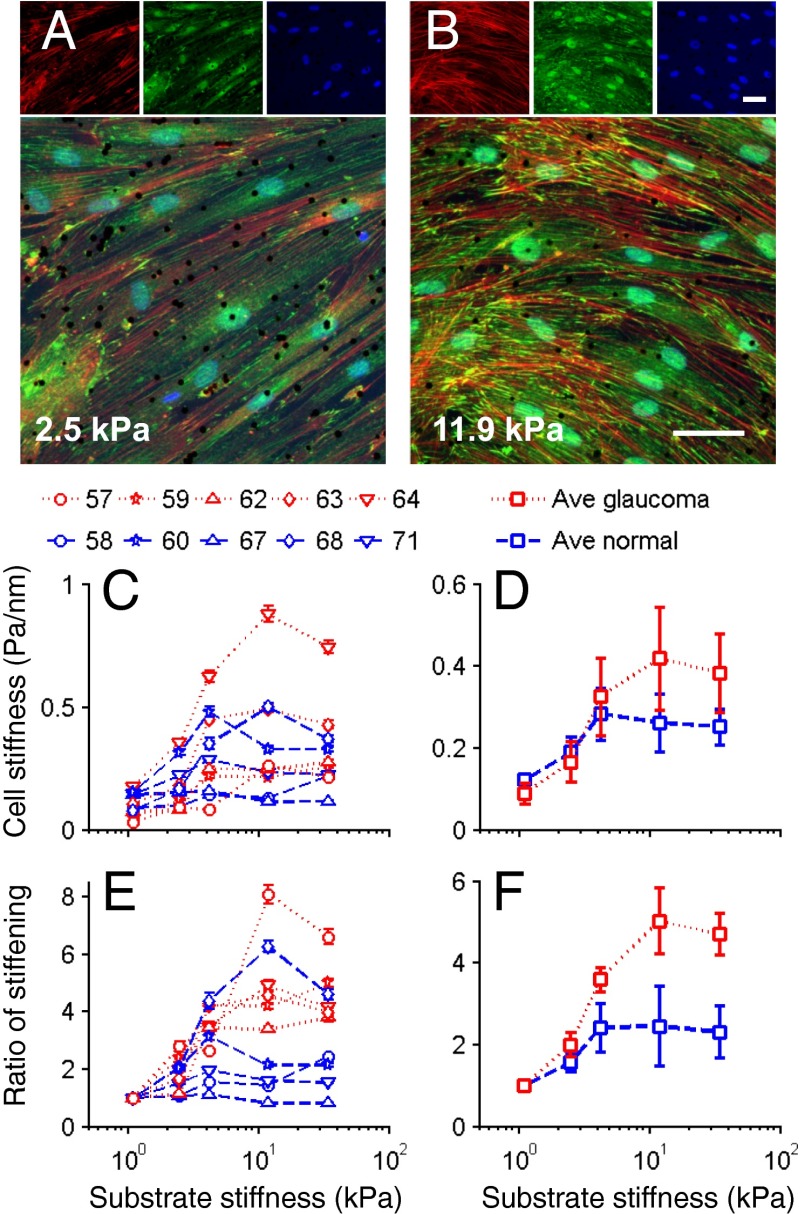
Fig. 4.
Influence of substrate stiffness on the biomechanical properties of SC cells. As the substrate stiffness increases, the stiffness of SC cells increases by different amounts in a donor- and disease-dependent manner. (A and B) Fluorescent micrographs of normal SC cells labeled for f-actin (red), vinculin (green), and DNA (blue) at two levels of substrate stiffness; black dots are 4.5-µm magnetic beads used for OMTC. (Scale bars: 50 µm.) (C and D) Cell stiffness index (g) of normal (blue) and glaucomatous (red) SC cells as measured by OMTC and expressed for individual cell strains (numbers above figure indicate cell strain) (C) or averages over all cell strains (D). (E and F) Stiffness index normalized by the value at the lowest substrate stiffness, expressed for individual cell strains (E) or averages over all cell strains (F). Median ± SEM with n > 600 beads for C and E; mean ± SEM with n = 5 cell strains each for D and F. Note that because the embedding depth of the beads in the cells is not known, an index of cell stiffness, g, is presented rather than an absolute value (44).

