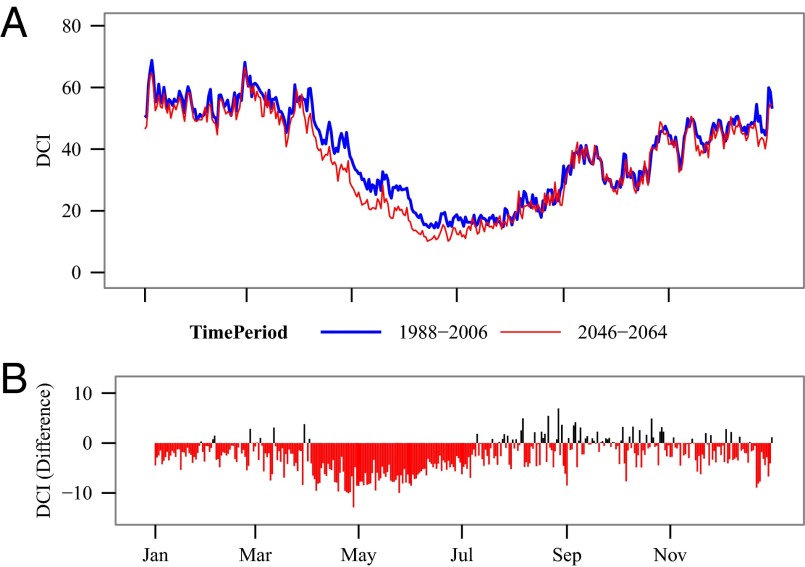
Fig. 4.
Dendritic Connectivity Index (DCI) using two-parameter exponential decay function for current (1988–2006) and future (2046–2064) simulation periods (A) and differences in mean daily DCI between the two time periods (B). Blue solid and red dashed lines (A) are mean daily DCI for the current and future time periods, respectively. Differences in mean daily DCI (B) are negative (red) or positive (black) for each day. Overall differences between current and future simulation periods reflect a 9% decrease (11% SD) in connectivity under climate change. Seasonal decreases in connectivity include 4% (4% SD) in winter, 17% (10% SD) in spring, and 5% (13% SD) in summer.

