
Fig. 1.
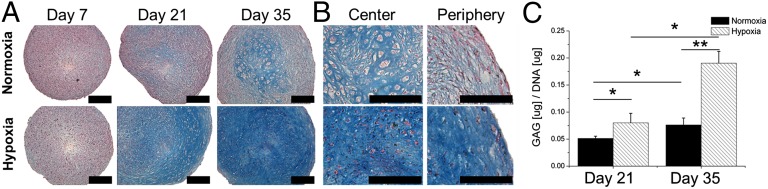
Hypoxia stimulates chondrogenic differentiation of MSCs. (A) Micromasses of MSCs were cultured for up to 35 d under either normoxic or hypoxic conditions. Histological analysis of midsagittal sections using Alcian blue and Nuclear Fast Red was used to visualize chondrogenic differentiation. (B) High-magnification microphotographs were taken of the center and periphery of the micromasses to visualize their cartilage phenotype. (C) Biochemical analysis of glycosaminoglycans (GAG) was used to quantify chondrogenesis. Data represent the mean of three donors, each measured in quadruplicate ± SD. *P < 0.05; **P < 0.01. (Scale bars: 100 μm.)