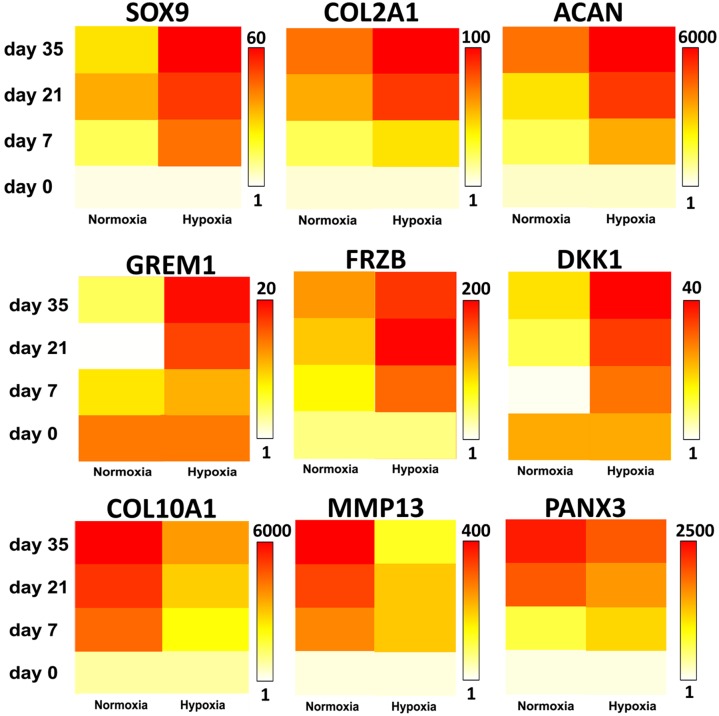
Fig. 3.
Hypoxia stimulated the expression of gene transcripts toward an articular cartilage-like profile. Chondrogenically differentiating MSCs in either normoxic or hypoxic conditions were analyzed for gene expression of the hyaline cartilage markers SOX9, COL2A1, and ACAN; the hypertrophic cartilage markers COL10A1, MMP13, and PANX3, and the articular cartilage markers GREM1, FRZB, and DKK1 by qPCR. Data are illustrated in a linear heat map in which white represents the lowest gene expression and red represents the highest gene expression, of which the maximal value is given in fold change. Data represent the mean of three donors, each measured in triplicate.

