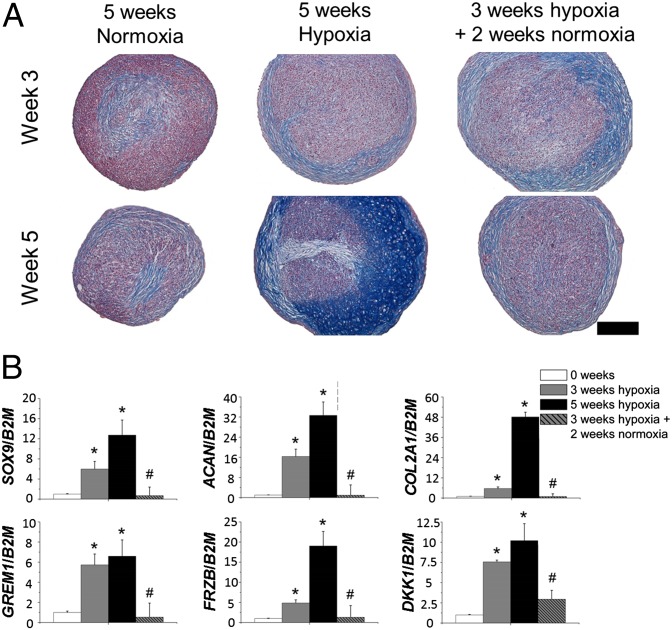
Fig. 5.
MSCs underwent chondrogenic differentiation for 5 wk in normoxia, 5 wk in hypoxia, or 3 wk in hypoxia followed by 2 wk in normoxia. (A) Histological analysis of glycosaminoglycans using Alcian blue and Nuclear Fast Red on midsagittal sections of MSC micromasses, which were chondrogenically differentiated for 3 or 5 wk. (Scale bar: 100 μm.) (B) Gene expression analysis of the articular cartilage markers SOX9, ACAN, and COL2A1 and the articular cartilage-enriched markers GREM1, FRZB, and DKK1. Data represent the mean of three donors, each measured in triplicate ± SD. *P < 0.05 for continuously hypoxic cultures compared with week 0; #P < 0.05 for 5-wk cultures that were noncontinuously hypoxic compared with 5-wk continuously hypoxic cultures.

