Fig. 2.
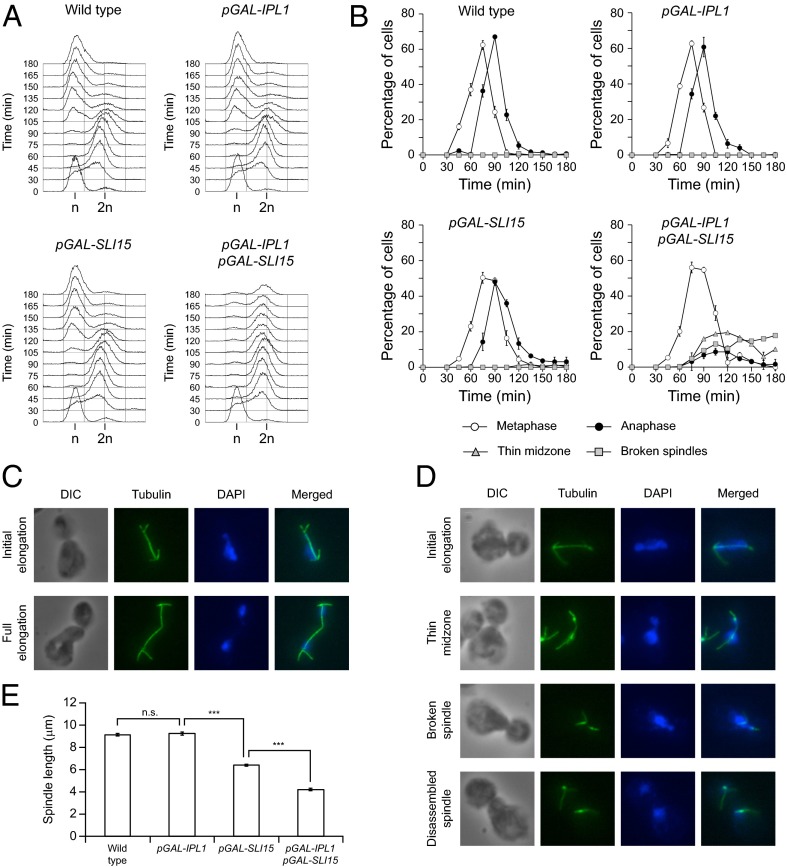
Cell-cycle progression after Ipl1 and Sli15 overexpression. Wild-type (F955), pGAL-IPL1 (F256), pGAL-SLI15 (F953), and pGAL-IPL1 pGAL-SLI15 (F947) cells were allowed to enter mitosis synchronously in YPRG as in Fig. 1A. (A) DNA content was determined by FACS analysis at the indicated time points. (B) Cell-cycle progression was analyzed by spindle (tubulin) and nuclear (DAPI) morphology. Percentages of metaphase and anaphase cells and of cells carrying spindles with a thin midzone and with broken spindles are shown for each time point. Error bars indicate SD (n = 3). (C and D) Representative images showing tubulin (green) and DAPI staining (blue) are presented for wild-type (F955) (C) and pGAL-IPL1 pGAL-SLI15 (F947) (D) cells. DIC, differential interference contrast. (E) Average maximum spindle length for each of the strains. Error bars indicate SEM (n = 150). Statistically significant (***P < 0.0001) or nonsignificant (n.s.) differences according to a two-tailed t test are shown.

