Fig. 5.
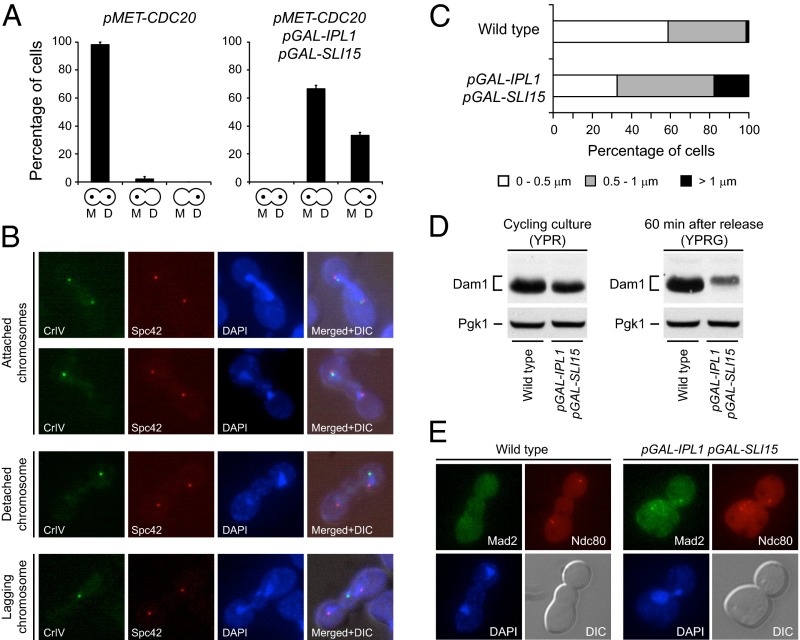
Increased Ipl1 and Sli15 expression causes continuous disruption of KT–MT attachments. (A) Analysis of chromosome segregation in pMET-CDC20 (F1670) and pMET-CDC20 pGAL-IPL1 pGAL-SLI15 (F1948) cells carrying CrIV-GFP. Cells were grown at 25 °C in synthetic complete (SC) medium with 2% raffinose and without methionine, were arrested in G1 with 5 μg/mL α-factor, and were released into SC with 2% raffinose and 8 mM methionine to impede CDC20 transcription and thus the metaphase-to-anaphase transition. Once cells were arrested in metaphase (2 h after release), 2% galactose was added to induce pGAL transcription, and 30 min later cells were released into SC with 2% raffinose and 2% galactose without methionine to allow cell-cycle progression. CrIV-GFP segregation was scored as in Fig. 3A, but no distinction was made between cells carrying one or two GFP dots. Error bars indicate SD (n = 3). (B and C) Wild-type (F1483) and pGAL-IPL1 pGAL-SLI15 (F1417) cells carrying CrIV-GFP and an mCherry-tagged version of Spc42 (a structural SPB component) were allowed to enter mitosis synchronously in YPRG as in Fig. 1A. (B) Representative images showing CrIV-GFP (green), Spc42-mCherry (red), and DAPI staining (blue), and merged images that also include DIC (merged+DIC) are presented. (C) Quantification of the average distance between the CrIV-GFP dot and the closest Spc42-mCherry signal (n = 150). (D) Wild-type (F2273) and pGAL-IPL1 pGAL-SLI15 (F2274) cells also expressing Dam1-3HA were allowed to enter mitosis synchronously in YPRG as in Fig. 1A. Western blot shows Pds1-3HA levels 60 min after release from α-factor. Pgk1 was used as a loading control. A Western blot displaying Dam1-3HA levels in cycling cultures of the same strains in YPR is shown as a reference. (E) Wild-type (F217) and pGAL-IPL1 pGAL-SLI15 (F1963) cells carrying Mad2-EGFP and Ndc80-CFP fusions were allowed to enter mitosis synchronously in YPRG as in Fig. 1A. Representative images showing Mad2-EGFP (green), Ndc80-CFP (red), DAPI staining (blue), and DIC are presented.

