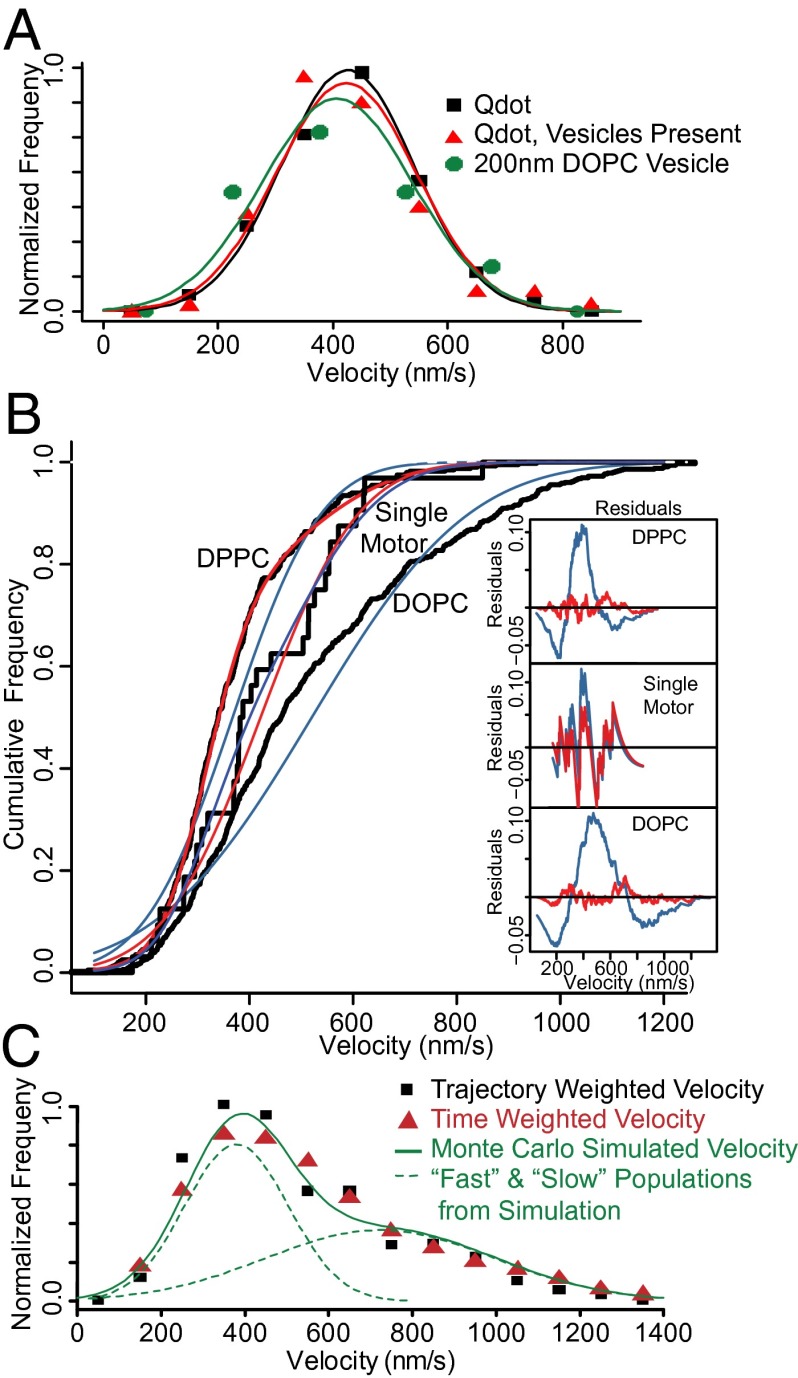
Fig. 3.
Vesicle velocity distributions demonstrate two populations. (A) Velocity distributions are statistically indistinguishable (P > 0.05) for single Qdot-labeled myoVa (black), Qdot-labeled myoVa with 200-nm DOPC vesicles added to the motility buffer (red), and 200-nm DOPC vesicles coupled to a limiting amount of myoVa, such that the majority of vesicles are coupled to a single motor (green). (B) Cumulative frequency distributions demonstrate that the observed velocities of 200-nm DOPC vesicles coupled to a single myoVa molecule are well described as a single-Gaussian population (blue fit to black data), whereas with increased numbers of motors, both DOPC and DPPC vesicle populations (200-nm diameter; eight motors per vesicle) are much better described as the sum of two Gaussian populations (red curves, nearly obscuring black data) than a single Gaussian (blue curves). These fits are supported by the large residuals that result from fitting a single-Gaussian population (Insets, colored to match distributions; tic marks on vertical axis indicate increments of 0.1), and an LLRT (P < 0.001), which indicates that the two-Gaussian fit is appropriate for both vesicle compositions (P < 0.01), but not the single motor case (P > 0.05). (C) Velocity distributions for 200-nm DOPC vesicles with eight motors per vesicle are nearly identical regardless of whether they are calculated on a per-trajectory basis or a “time-weighted” basis, and yield nearly identical fitted values. The green curve indicates the velocity distribution generated by the Monte Carlo simulation of vesicle motility, as well as the two constituent Gaussian populations (dashed lines).

