Fig. 7.
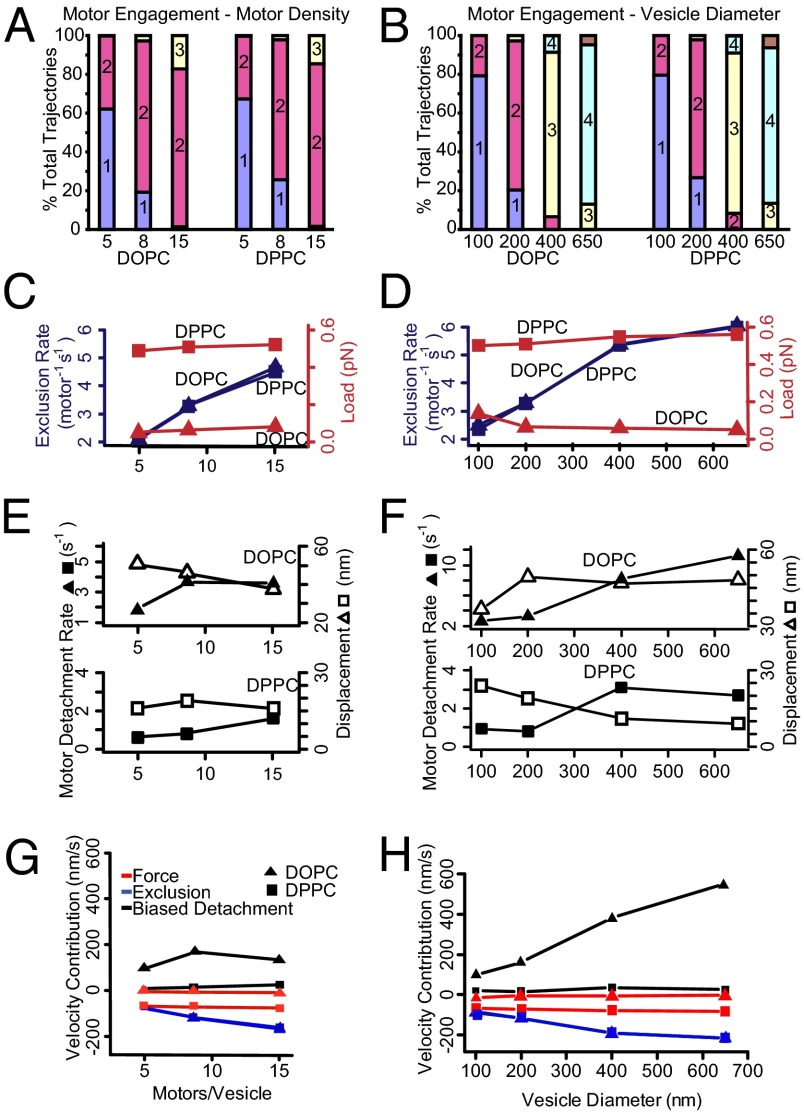
Model mechanisms that alter vesicle velocity. (A and B) Median motor engagement is predicted by the simulation on a per-trajectory basis and increases only slightly with increasing motor number and more so with increasing vesicle diameter. The colored bars indicate the proportion of trajectories that have a median number of engaged motors over the course of the trajectory. (C and D) Reductions in velocity are attributable to two main mechanisms—one load-based modulation of motor stepping rate and one based on obstruction of actin-binding sites so as to limit a motor’s forward step. For each vesicle condition simulated, the median absolute load experienced by each motor (red) is strongly influenced by vesicle composition, whereas the frequency of obstructed steps (blue) increases with both motor density and vesicle diameter. (E) The trailing motor detachment rate (closed symbols) is accelerated with increasing motor density on DOPC vesicles. However, the net vesicle movement upon trail motor detachment (ΔX, open symbols) decreases with motor density. Similar trends are predicted for DPPC vesicles but the absolute values are lower. (F) As in E, the trailing motor detachment rate (closed symbols) is dramatically accelerated with DOPC vesicle diameter. However, the net vesicle movement upon trailing motor detachment (ΔX, open symbols) remains nearly constant. Therefore, the enhancement of vesicle velocity for increasing DOPC vesicle diameters is governed by the trailing motor detachment rate (see H). The contribution of this effect is minimal for DPPC vesicles. (G and H) Predicted changes to vesicle velocities attributable solely due to biased detachment of trailing motors (black), load-based modulation of motors’ stepping kinetics (red), and actin-binding site exclusion of motor stepping (blue).

