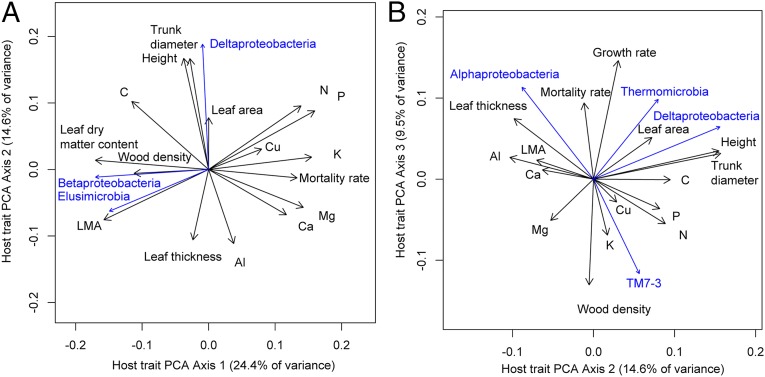
Fig. 5.
Relationships between microbial community structure and suites of correlated plant host traits on Barro Colorado Island, Panama. (A and B) Axis 1 vs. 2 (A) and axis 2 vs. 3 (B) from a principal components analysis (PCA) of host plant traits across 217 plant species. These axes explain 49% of the variation in the data. Arrow direction indicates the correlation among traits, arrow length indicates the strength of the correlation. Black arrows indicate correlations among plant traits, blue arrows indicate significant correlations (P < 0.05) between PCA axes vs. the relative abundances of sequences from different microbial classes measured on a subset of 57 host species. LMA, leaf mass per area.

