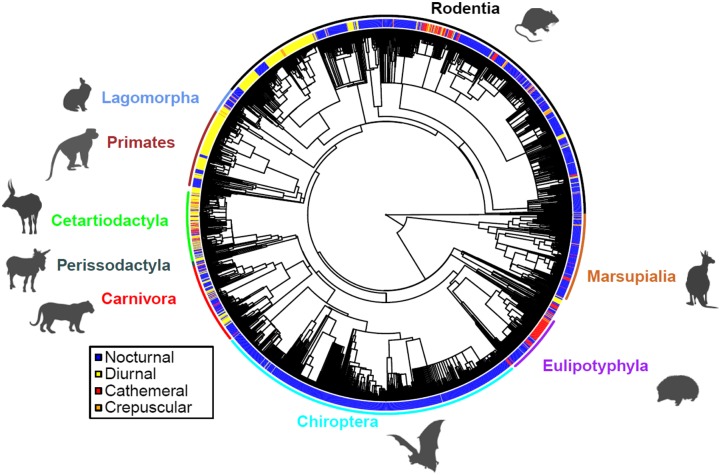
Fig. 2.
Phylogenetic tree showing 3,510 mammal species allocated to one of four time-partitioning strategies. The colored radial bars represent the dominant time-partitioning strategy for the species from an extensive literature search; the internal radial tree shows a species-level mammal phylogeny (55, 56). Selected major clades are shown.

