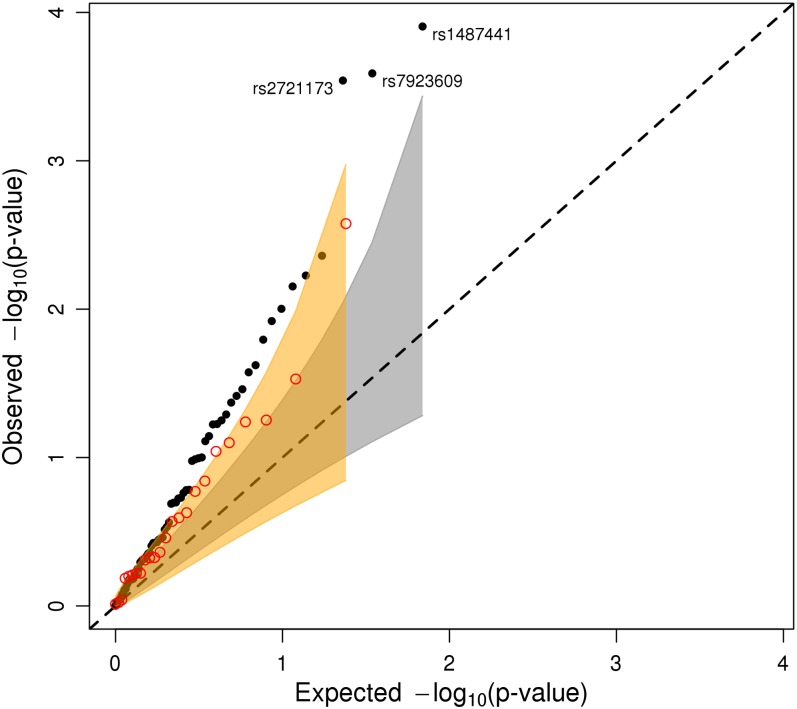
Fig. 2.
A Q–Q plot for a regression of cognitive performance on the education-associated SNPs (black circles) with a 95% confidence interval around the null hypothesis (gray shaded region) and a Q–Q plot for a regression of cognitive performance on the theory-based SNPs (red circles) with a 95% confidence interval around the null hypothesis (orange shaded region).

