Fig. 1.
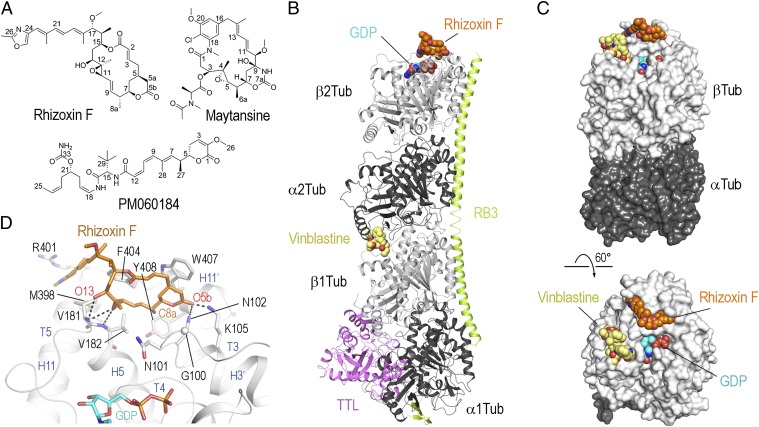
Structure of the tubulin–rhizoxin F complex. (A) Chemical structures of rhizoxin F, maytansine, and PM060184. (B) Overall view of the T2R-TTL–rhizoxin F complex. Tubulin (gray), RB3 (light green), and TTL (violet) are shown in ribbon representation; the MDA rhizoxin F (orange) and GDP (cyan) are depicted in spheres representation. As a reference, the vinblastine structure (yellow, PDB ID no. 1Z2B) is superimposed onto the T2R complex. (C) Overall view of the tubulin–rhizoxin F interaction in two different orientations. The tubulin dimer with bound ligand (α-tubulin-2 and β-tubulin-2 of the T2R-TTL–rhizoxin F complex) is shown in surface representation. The vinblastine structure is superimposed onto the β-tubulin chain to highlight the distinct binding site of rhizoxin F. All ligands are in sphere representation and are colored in orange (rhizoxin F), cyan (GDP), and yellow (vinblastine). (D) Close-up view of the interaction observed between rhizoxin F (orange sticks) and β-tubulin (gray ribbon). Interacting residues of β-tubulin are shown in stick representation and are labeled.

