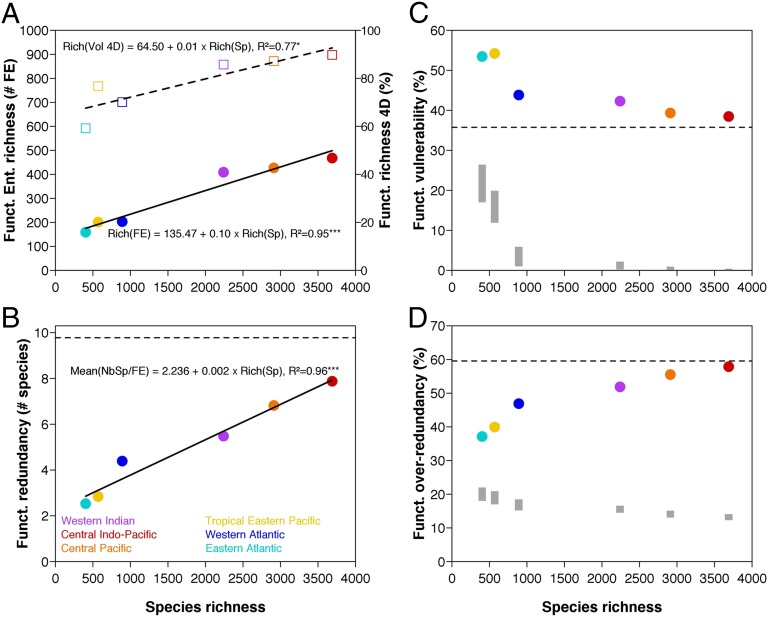
Fig. 2.
Relation between species richness and (A) functional richness, (B) functional redundancy, (C) functional vulnerability, and (D) functional over-redundancy across six tropical-reef fish faunas. Functional richness is expressed in terms of both the number of functional entities (circles) and the functional volume (squares) filled by fish faunas. Functional redundancy is the mean number of species per functional entity, functional vulnerability is the percentage of functional entities having only one species, with functional over-redundancy as the percentage of species in functional entities having more species than expected from functional redundancy. Horizontal dashed lines symbolize the index values measured on the global pool of species in B, C, and D. Linear regressions are plotted for functional richness (continuous line for entities and dashed line for volume) and functional redundancy whereas results from null models are provided for functional vulnerability and functional over-redundancy. Gray bars in C and D represent 95%-confidence interval of expected values under a null model simulating a random assignment of species into functional entities.

