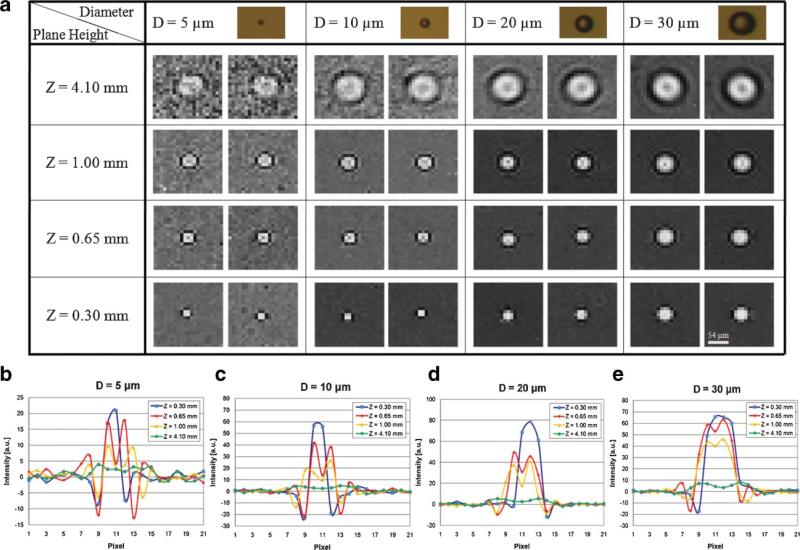
Figure 7.
a: LUCAS signature library of various micro-beads (D = 5, 10, 20, and 30 μm) located at different planes (S = 0.30, 0.65, 1.00, and 4.10 mm). Each specific entry shows two images to illustrate the uniformity of the acquired shadow signatures. b–e show the cross-sectional amplitude variations in 5 μm (b), 10 μm (c), 20 μm (d) and 30 μm (e) diameter beads, respectively. [Color figure can be seen in the online version of this article, available at www.interscience.wiley.com.]

