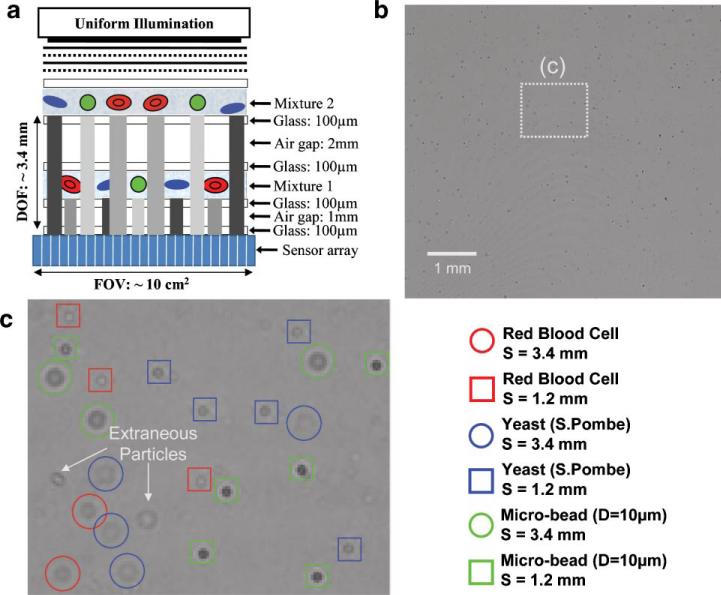
Figure 8.
The results of an automated LUCAS characterization of a heterogeneous mixture of RBCs, yeast cells and 10 μm beads imaged over a DOF of ~3.4 μm are illustrated. a: The same heterogeneous mixture is loaded on two different planes (S = 1.2 μm and S = 3.4 μm) and imaged using LUCAS. b: LUCAS raw image of this two layered mixture is shown. c: The results of the LUCAS decision algorithm are illustrated. The unique diffraction signature of each RBC, yeast cell and microbead located at two different layers (separated by >2 μm) is identified automatically. The details of the 2D correlation maps that are used for the decision making are illustrated in Figure 9 for each cell/micro-object type. [Color figure can be seen in the online version of this article, available at www.interscience.wiley.com.]

