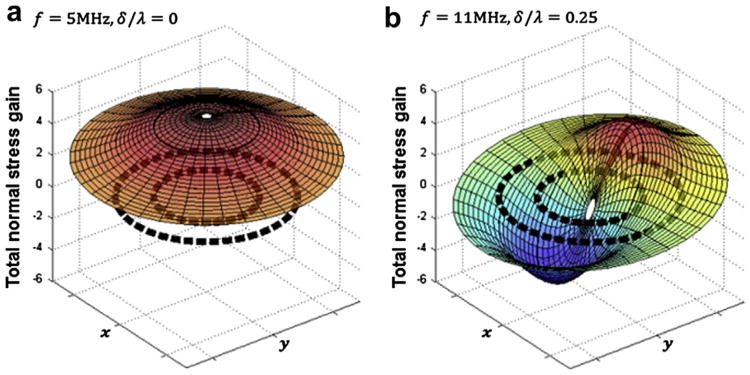
Fig. 6.
Snapshot of the oscillating normal stresses in the cell at a moment in time as a function of (r, θ) →(x,y). Dashed black lines indicate the position of the plasma and nuclear membranes. (a) At an antinode, f = 5 MHz, the normal stresses are uniformly distributed throughout the cell, with a maximum in the center (i.e., nucleus). Because of the uniformity of the normal stresses, shear stress is reduced. (b) At a node, f = 11 MHz, the opposing normal stresses causes shear stress in the cell.

