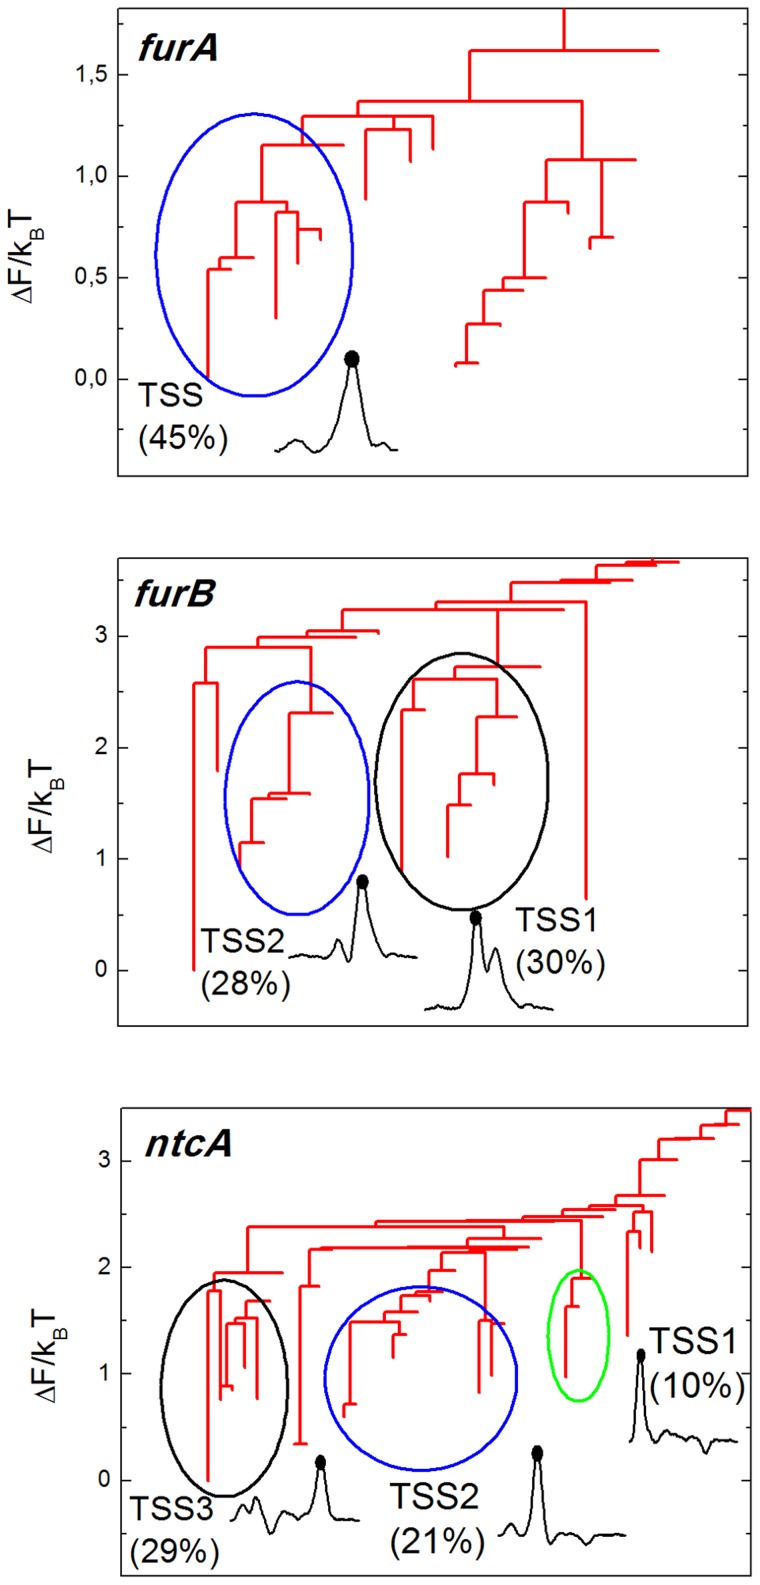
Figure 4. Hierarchical free energy dendrogram for three selected promoters.
Basins of attraction separated by barriers lower than  are clustered to define macrostates of the system. Their weight is indicated in the plot together with a representation of the physical state they represent, typically the particle located in a certain site where a bubble opens.

