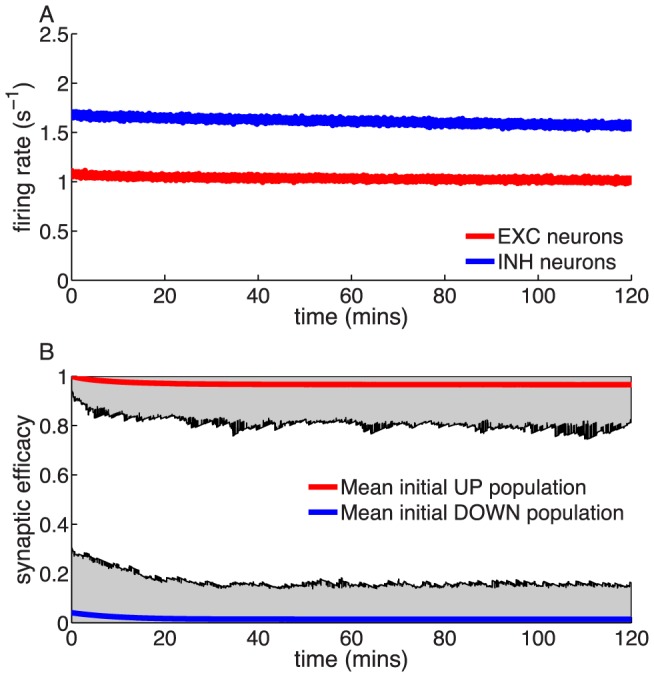
Figure 6. Memory decay for a subset of potentiated synapses in a recurrent network with the in vivo parameter set and double-well potential.

(A) Temporal evolution of the average excitatory (red) and inhibitory (blue) firing rate. A network of 10,000 LIF neurons is initialised at the theoretically predicted steady-state and simulated for 120 min real time. (B) Temporal dynamics of synaptic efficacies in the network. The average dynamics of the 95% initialised in the DOWN state (blue) and the 5% initialised in the UP state (red) is shown. The shaded gray region represents the range of values visited by synapses in the UP and in the DOWN state populations, indicating that no transition occurs.
