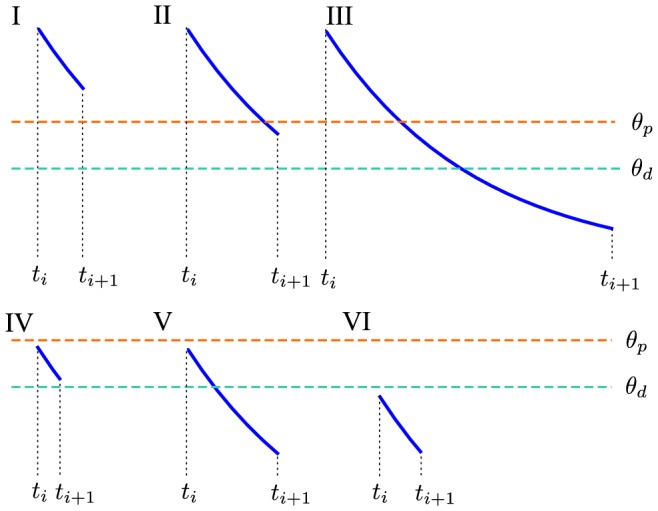
Figure 7. Possible potentiation and depression threshold crossing cases of the calcium trace (blue lines) between events at time  and
and  .
.

The six possible cases are depicted with respect to the location of the potentiation,  (orange dashed line), and the depression thresholds,
  (cyan dashed line).
