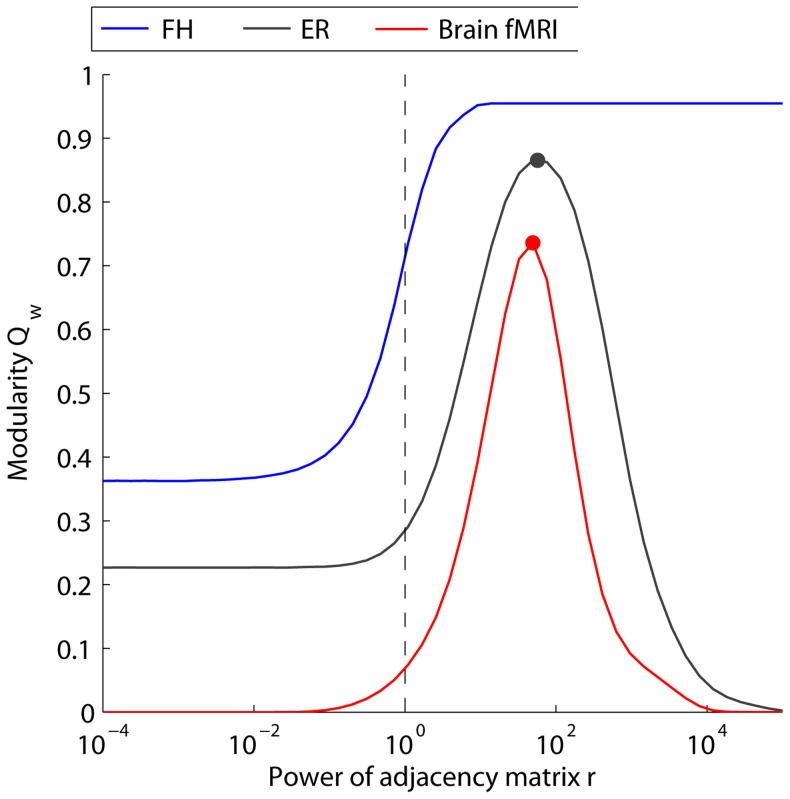
Figure 3. Use of soft thresholding strategies to probe geometric drivers of weighted modularity.
Changes in maximum modularity  as a function of the control parameter
  for soft thresholding. MRFs are presented for synthetic (fractal hierarchical, FR, in blue; Erdös-Rényi, ER, in black) and empirical (Brain fMRI in red) networks. Dots mark the peak value for different curves, which occur at different values of
  . The vertical dashed line marks the conventional value of
  obtained for
  . The single, point summary statistic
  fails to capture the full structure of the MRF revealed using soft thresholding.

