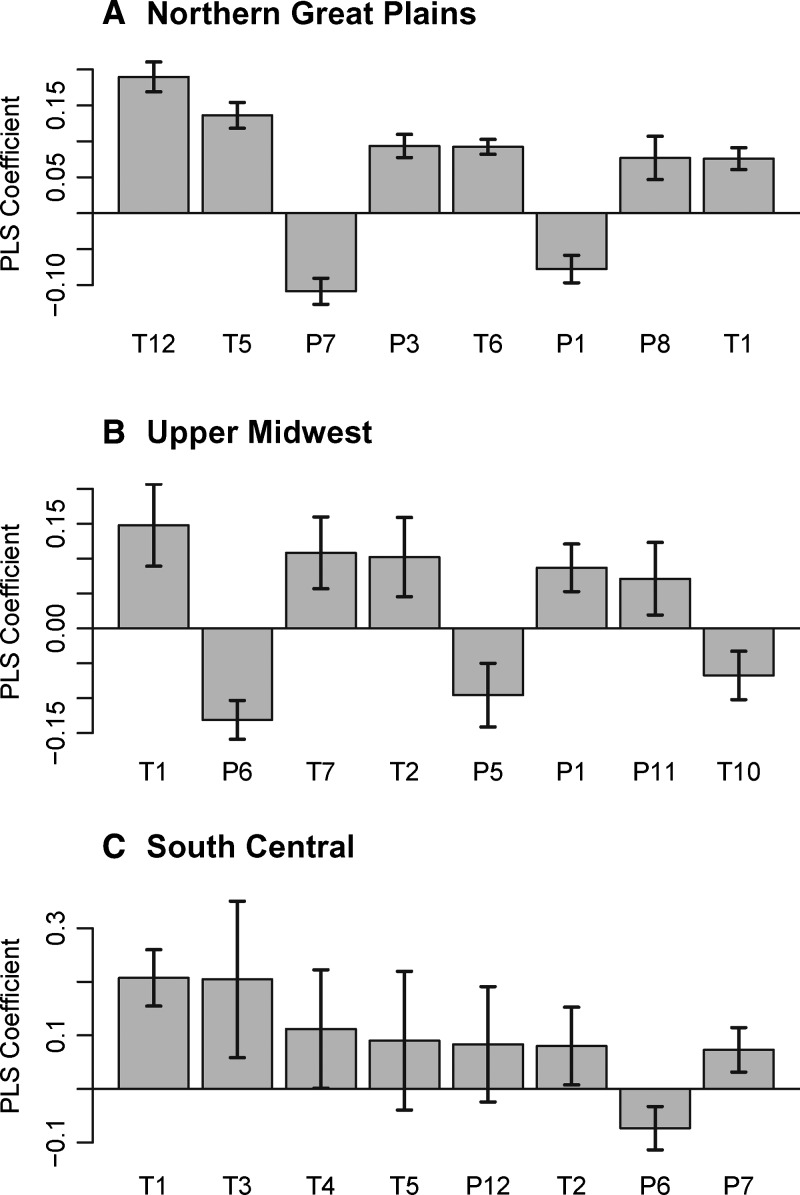
Figure 4.
Standardized PLS regression coefficients for the three study regions. The coefficients with the eight highest absolute values are presented in decreasing order for each region. Error bars represent SEs estimated using a jackknife procedure. (A) NGP. (B) UM. (C) SC. Numbers represent months (1 = January, 2 = February, etc.). P = precipitation; T = temperature.

