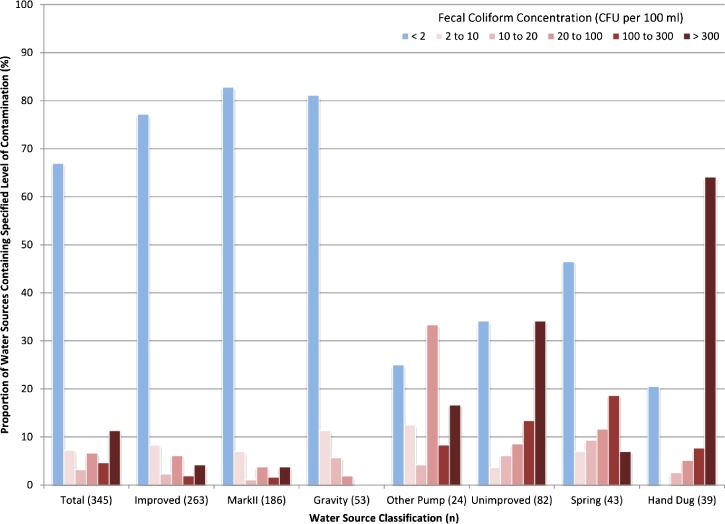
Figure 3.
Distribution of fecal coliform concentrations from all water sources The overall distribution of water samples containing fecal coliforms at various concentrations from the limit of detection (2 CFU/100 mL) to greater than or equal to 300 CFU/100 mL is shown. The levels of fecal contamination are further divided into the improved and unimproved categories and their respective subcategories, which show the proportion of water sources in each category with the level of fecal coliform contamination specified by the legend from the least amount (dark red) to the highest levels (light pink).

