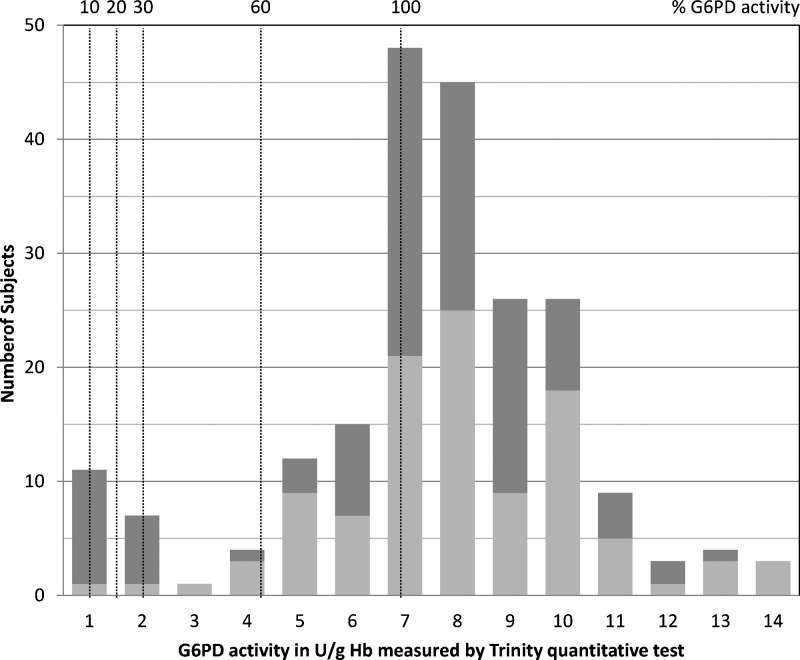
Figure 1.
Distribution of G6PD activities for the study population described in Table 1 indicating 10%, 20%, 30%, 60%, and 100% of normal activity for this population. Normal activity was defined as the adjusted G6PD median activity value for normal males. Females are indicated by light gray bars, and males are indicated by dark gray bars. N = 214 (107 females and 107 males).

