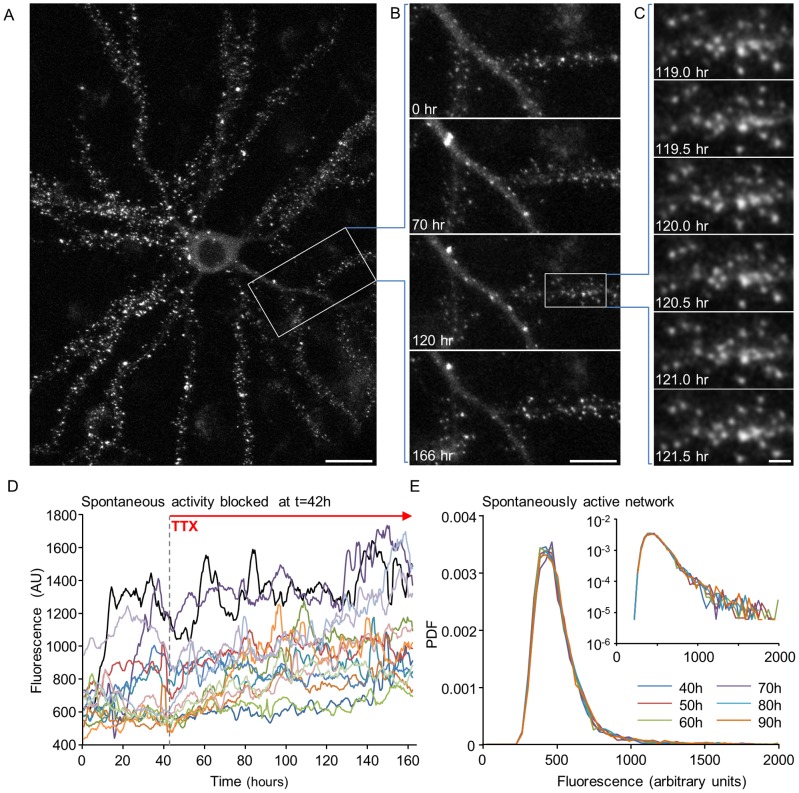
Figure 1. Synaptic remodeling and synaptic size distributions in long-term experiments.
(A) A single neuron expressing PSD-95:EGFP. Fluorescent puncta represent postsynaptic sites formed on dendritic spines and shafts. (B) A 7-day time-lapse series (30 min intervals, or 48 images/day) of the region enclosed in a rectangle in A. Only a small subset of the data is shown here. (C) Magnification of region enclosed in a rectangle in B, demonstrating the actual temporal and spatial resolution of imaging data collected in these experiments. All images in panels A–C are maximal intensity projections of 9 images collected at 9 focal planes spaced 0.8 µm apart. Bars: A, 20 µm; B, 10 µm; C, 2 µm. (D) Fluorescence of synapses as a function of time (“synaptic trajectories”; measurement taken every 30 min) of 16 synapses in a spontaneously active network to which TTX was added at t = 42 hours. Data is shown after smoothing with a 5 time point window to decrease the effects of measurement noise, and after normalizing the fluorescence values by the average over the entire experiment. (E) Probability density function (PDF) of PSD-95:EGFP puncta fluorescence values at 10 hour intervals in a spontaneously active network. Inset: the same data on semi-logarithmic axes.

