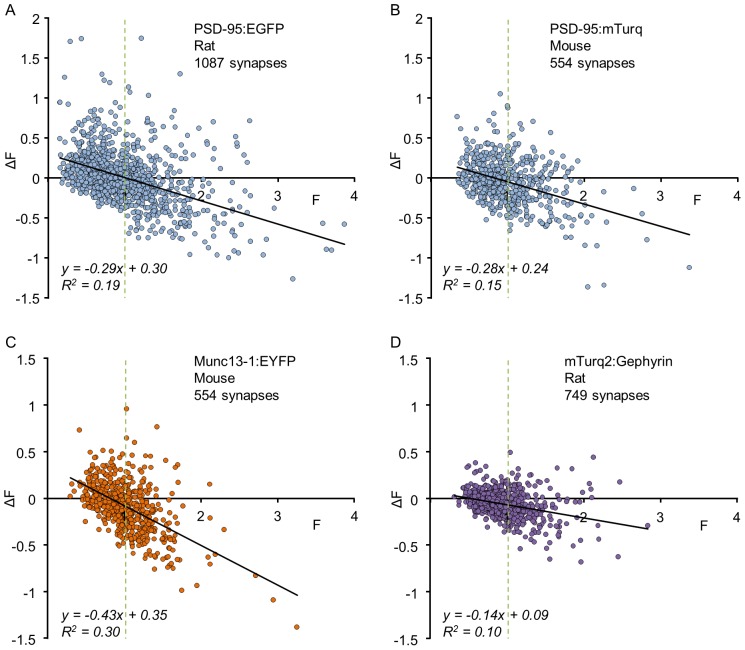
Figure 2. Changes in the fluorescence of individual synapses as a function of their initial fluorescence.
Each dot represents one synapse. ΔF represents the change in fluorescence after a given time interval. Data were normalized by dividing the fluorescence of each synapse by the average fluorescence of all synapses at time t = 0 to allow pooling of data from multiple neurons irrespective of some variability in neuron-to-neuron expression levels. Solid lines are linear fits; vertical dashed lines highlight the average synaptic size ( = 1, after normalization). All data was obtained under baseline conditions from unperturbed networks. (A) Rat cortical neurons expressing PSD-95:EGFP; 1087 synapses from 10 neurons in 5 separate experiments. Images were collected at 30 min intervals; ΔF was measured after a 24 hour interval (see ref [20] for further details). (B) Mouse cortical neurons expressing PSD-95:mTurquoise; 554 synapses from 8 neurons in 6 separate experiments. Images were collected at 25 min intervals; ΔF was measured after a 15 hour interval (see ref [63] for further details). (C) Mouse cortical neurons expressing munc13-1:EYFP; 554 synapses from 8 neurons in 6 separate experiments. Imaging was performed as in B (see ref [63] for further details). (D) Rat cortical neurons expressing mTurquoise2:Gephyrin; 749 synapses from 27 neurons in 4 experiments. Images were collected at 60 min intervals; ΔF was measured after a 24 hour interval (Anna Rubinski and Noam E. Ziv, unpublished data).

