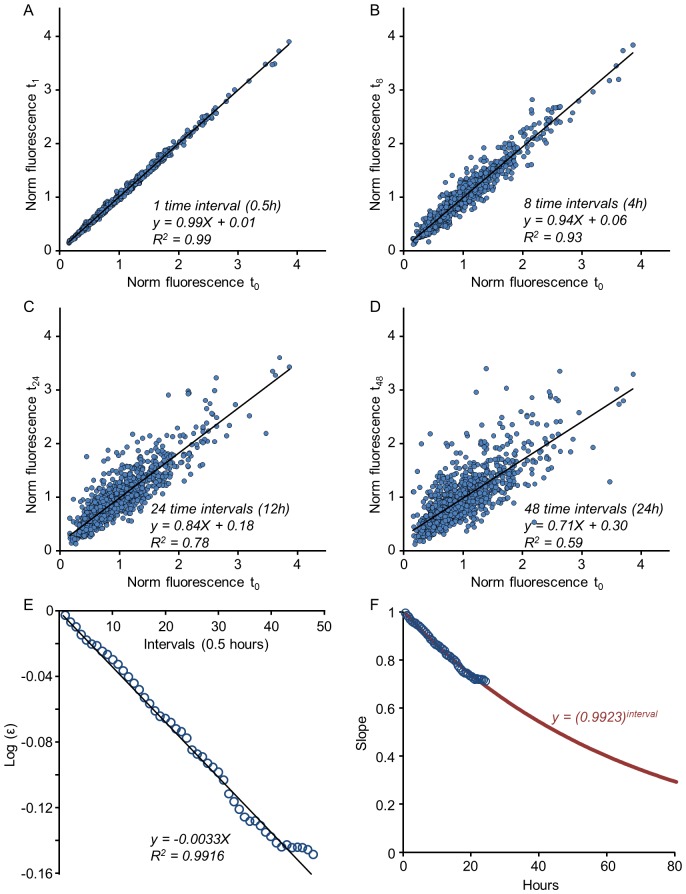
Figure 4. Estimating Kesten parameters in experimental data.
An estimate of the parameter  can be obtained from k-times iterated mappings of the data as explained in text. These mappings are shown for 1, 8, 24 and 48 time-steps, corresponding to 0.5, 4, 12 and 24 hours respectively (A–D); from each such mapping the slope of the linear regression (solid black line) is extracted. (E) The logarithmic values of these slopes (circles) plotted as a function of iteration number and fit by linear regression (solid black line) to obtain an estimate of
  . (F) The measured slopes (circles) with the predicted slope values (red line) over an extended time scale.

