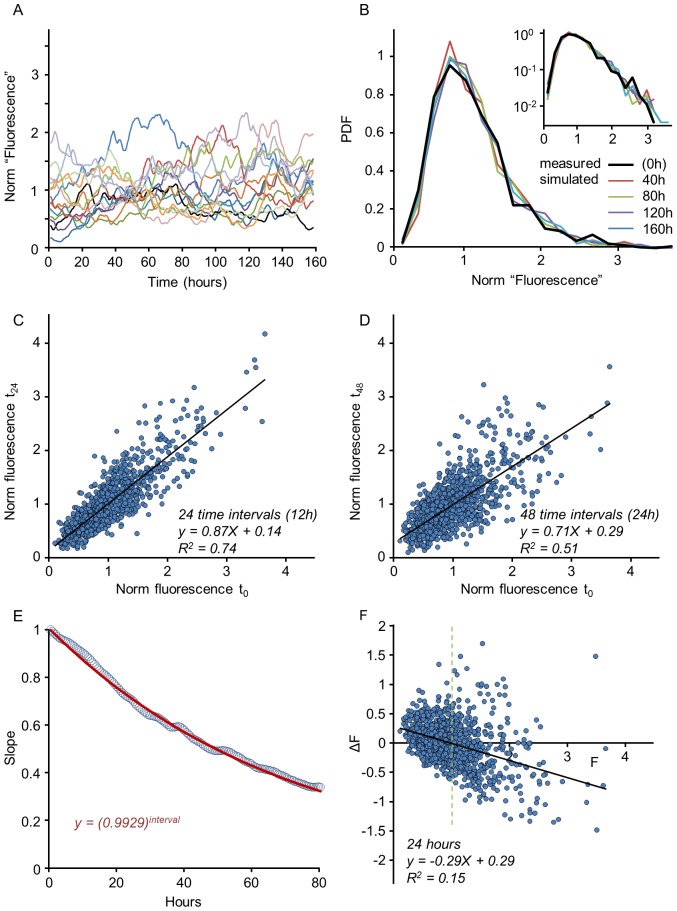
Figure 5. Properties of the Kesten process in estimated parameter regime.
(A) Simulated synaptic trajectories of 14 out of 1075 synapses, evolved for 160 hours at 30 min intervals. Synapses were sorted according to initial size and then every 76th trajectory was selected for display (compare with Fig. 1D). The Kesten process parameters used here were based on the estimate shown in Fig. 4 ( = 0.9923±0.05; 〈η〉 = 0.0077±0.03) and values were obtained from Gaussian distributions with these parameters. The initial data set (1087 synapses) was identical to that shown in Figs. 2A and 4; 12 synapses were ‘lost’ during the simulation (i.e. their values reduced to 0) and were excluded from subsequent analysis. (B) Synaptic distributions along time, starting from a measured distribution (thick black line) and applying the time evolution of the Kesten process to this initial population. Four subsequent time points are plotted as indicated. Inset shows the same distributions on a semi-logarithmic scale. (C,D) Examples of k-times iterated mappings corresponding to 24 and 48 time-steps (compare with Fig. 4C,D). (E) Slope of k-times iterated mappings as a function of k in simulated trajectories (circles) and in a theoretical prediction based on Eq. (3) (red solid line, red equation). (F) Scatter plot of changes in synapse size as a function of initial size for simulated trajectories for the period covering first 24 hours of the simulation. Note the strong resemblance with the experimental measurements of Fig. 2A.

