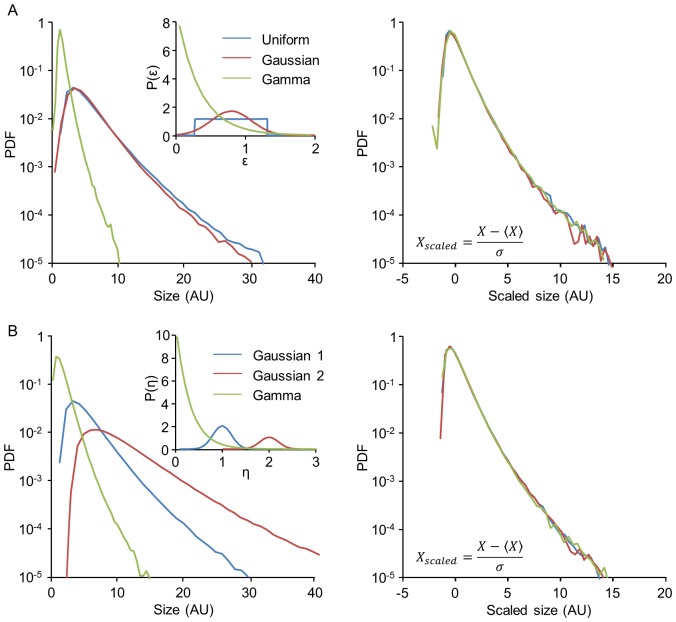
Figure 6. Invariance of Kesten limiting distribution shape to different ε- and η- distributions.
(A) Simulated limiting distributions of Kesten processes with the three different ε-distributions shown in inset, all belonging to the same μ-class 6, that is, 〈ε 6〉 = 1. The distribution of η was held fixed. The same three distributions after scaling are shown on the right. (B) Simulated limiting distributions of Kesten processes with the three different η-distributions shown in the inset. The distribution of ε was held fixed. The same three distributions after scaling are shown on the right.

