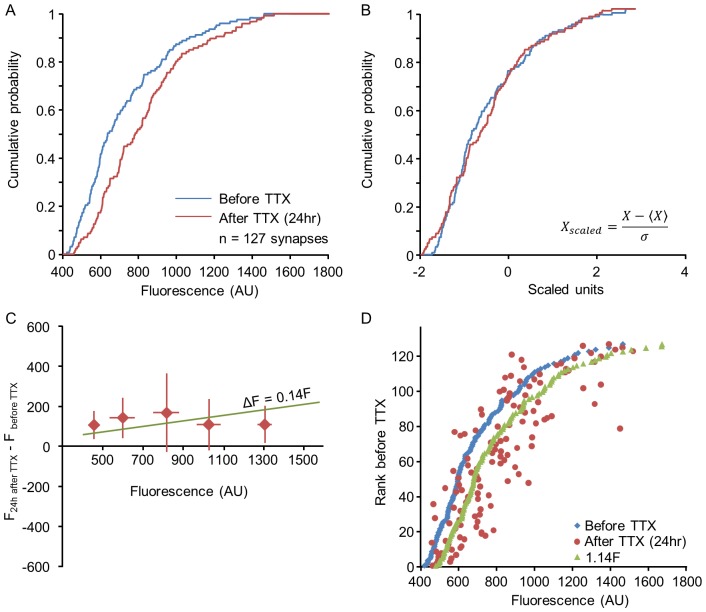
Figure 7. Scaling of synaptic size distributions following application of TTX.
(A) Cumulative distribution of synaptic sizes all belonging to a single neuron, before (blue), and 24 hours after (red) applying TTX, which suppresses all spontaneous network activity. (B) Same distributions shown in A after scaling. (C) Changes in the fluorescence of individual synapses (ΔF) during the first 24 hours after TTX addition (averages and standard deviations of binned data) reveal no particular relationships with their initial size (F). The green line represents the expected relationships between ΔF and F had sizes of individual synapses scaled through multiplication by 1.14 (the ratio of mean synaptic size before and after TTX addition). (D) Scaling of synaptic size distributions does not preserve rank order. Synapses were sorted according to their size before TTX addition and plotted according to their original sizes (blue dots). The sizes of the same synapses 24 hours after TTX addition are shown as red dots. Note the significant departure from the original rank order. Expected synaptic rank order vs. new size, had synapse growth followed individual multiplicative scaling, is shown as green dots. Data from one of the two neurons shown in Figs. 1E–G.

