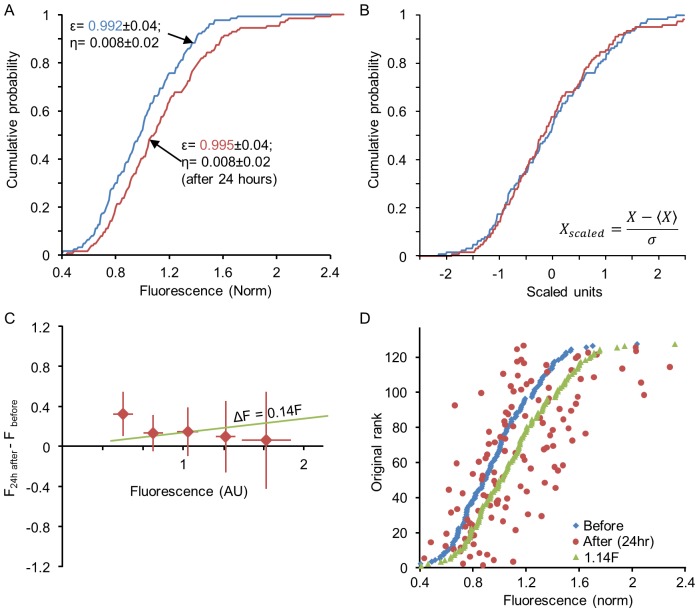
Figure 9. Distribution rescaling with individual rank-order shuffling in the Kesten process.
The Kesten process provides a simple mechanism for population distribution rescaling without individual multiplication by a constant factor. Simulations were performed for 127 synapses (initial values taken from the synapses of Fig. 7). The synapses were first evolved for 24 hours (48 time points) with a Kesten process that preserved the original distribution. At this point  was slightly increased (from 0.992 to 0.995), and the trajectories were evolved for another 24 hours with the new parameters. (A) Distributions before (blue) and after (red) changing
  . (B) Same distributions shown in (A) after scaling. (C) Changes in the fluorescence of individual synapses (ΔF) during the first 24 hours after changing
  (averages and standard deviations of binned data). The green line represents the expected relationships between ΔF and F had sizes of individual synapses scaled through multiplication by 1.14 (the ratio of mean synaptic size before and after changing
  . (D) Scaling without preserving rank order. Synapses were sorted according to their size before changing
  and plotted according to their original sizes (blue dots). The ‘sizes’ of the same synapses 24 hours after changing
  are shown as red dots. As in the experiments of Figs. 7 and 8, rank order is not preserved. The expected synaptic ‘sizes’, had scaling occurred multiplicatively, are shown as green dots.

