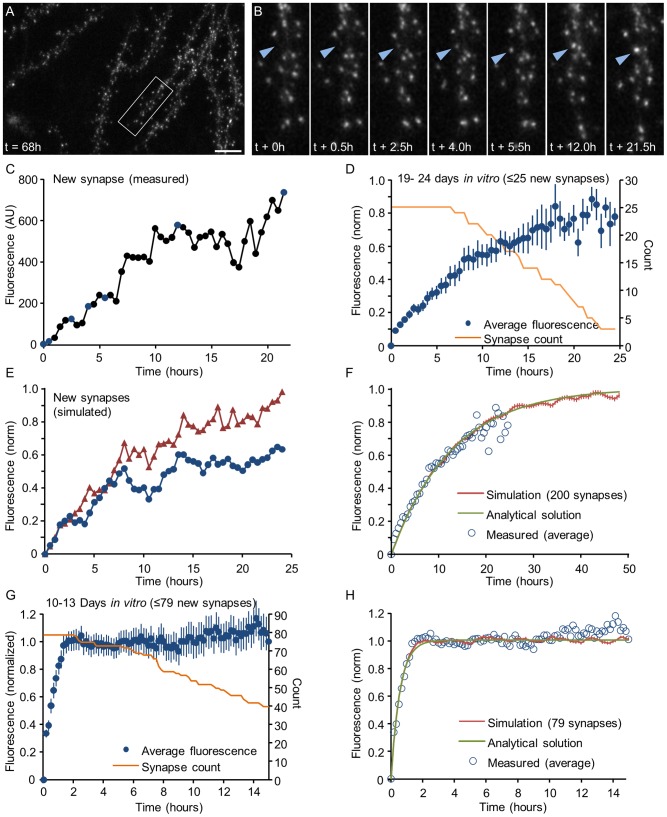
Figure 10. Kinetics of formation of new postsynaptic densities.
A,B) The formation of a new PSD. Left panel: low magnification image of a dendrite 68 hours after the beginning of a time lapse session (started at 21 days in vitro). Right panels: gradual accumulation of PSD-95:EGFP at a new site (blue arrowhead). Bar: 10 µm. C) Time course of PSD-95:EGFP accumulation at the new site shown in A. The blue dots indicate the time-points of the images shown in B. D) Mean time course of new PSD formation in mature (>21 days in vitro) networks (average ± SEM). Data, pooled from 4 neurons, was aligned to the first time point at which a new PSD was observed. The fluorescence of each new synapse was normalized by subtracting the fluorescence value measured at its future location before a PSD was first detectable, and then divided by the background corrected mean fluorescence of the preexisting PSDs of that neuron. The number of new PSDs used to calculate the data points is shown as an orange line. E) Two simulated trajectories of new synapses, seeded with an initial value of 0.05 and evolved as a Kesten process with parameters  = 0.962±0.06 and 〈η〉 = 0.038±0.03 (Gaussian distributions). The resulting trajectories were normalized as the experimental data shown in D. F) Mean time course of synapse formation calculated analytically by equation (5) (green) and averaged over 200 simulated Kesten trajectories (red, average ± SEM) evolved and normalized as described in E. Open circles represent the experimentally measured data shown in D. G) Synapse formation in developing networks: mean time course of new PSD formation in developing networks (10–13 days in vitro; average ± SEM). Data, pooled from 3 neurons, was normalized as in D. The number of PSDs used to calculate the data points is shown as an orange line. H) Mean time course of synapse formation in developing networks calculated analytically based on equation (5) (green) and averaged over 79 simulated Kesten trajectories (red, average ± SEM). The parameters used for these simulations and calculations were 〈ε〉 = 0.74±0.06 and 〈η〉 = 0.26±0.03 (Gaussian distributions; 〈η〉 was constrained by
  as explained in main text). Note that these reflect values for 10 minute steps (equivalent to
  = 0.405 for half hour steps). Open circles represent the experimentally measured data shown in G.

