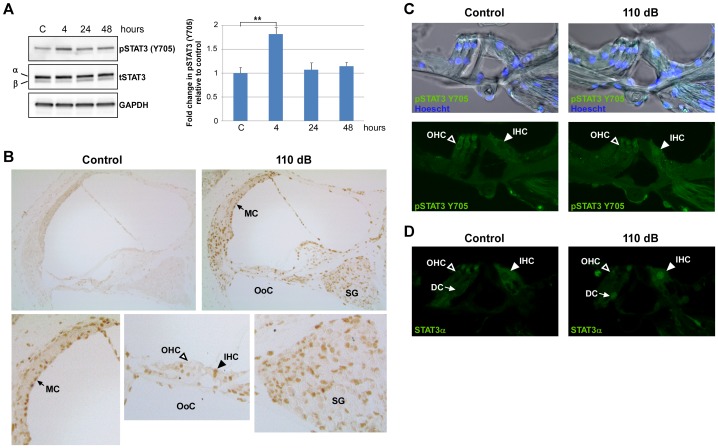
Figure 2. Loud exposure induces STAT3 phosphorylation in the cochlea.
The effect of loud sound on the phosphorylation status of STAT3 in the whole cochlea was examined. (A) Left Panel: Representative Western blots of pSTAT3 (Y705) and total STAT3 (tSTAT3), both α and β isoforms, in total cochlea extracts at 0, 4, 24 and 48 hours post noise exposure (NE) (110 dB SPL, 4–48 kHz, 3 hrs). Right Panel: Fold change in pSTAT3 (Y705) levels relative to control at the different time points. The results were normalized to tSTAT3 levels, and GAPDH served as the loading control. Data presented as mean+SEM, n = 3 mice/time point. **P<0.001. (B) Immunohistochemical staining of paraffin sections for pSTAT3 (Y705) at 4 hours post NE. Loud sound induced STAT3 (Y705) phosphorylation was observed in many cell types including type II fibrocytes, stria vascularis marginal cells, inner hair cells and spiral ganglion cells. Enlarged images show noise-induced pSTAT3 labeling in the nuclei of marginal cells (MC, arrow), spiral ganglion cells (SG) and inner hair cells (IHC, closed arrow head), but not in outer hair cells (OHC, open arrow head) in the organ of Corti (OoC). Representative images for control and NE mice are shown, and each figure is representative of 3 individual mice analyzed for each treatment group. (C) Immunohistochemical staining of vibratome cut whole mount cochlea sections at 4 hours post NE for pSTAT3 (Y705) (green) demonstrated the presence of fluorescent signal in the IHC nuclei of noise exposed mice which was absent in the OHC nuclei. Upper panels: bright field images of pSTAT3 immunolabeled organ of Corti showing the cellular architecture of the organ of Corti. (D) Immunolabeling for STAT3α (green) at 4 hours post NE showed fluorescent signal in the IHC nuclei of noise exposed mice and not in the OHC nuclei. The immunolabeled tissue sections presented in (C) and (D) were obtained from the same treatment groups. Open arrow heads point to OHC nuclei, closed arrow heads point to IHC nuclei, and the arrows point to Deiters cell nuclei (DC). All sections (B–D) are from the mid-basal turn of the cochlea, and each figure is representative of 3 individual mice analyzed for each treatment group.

