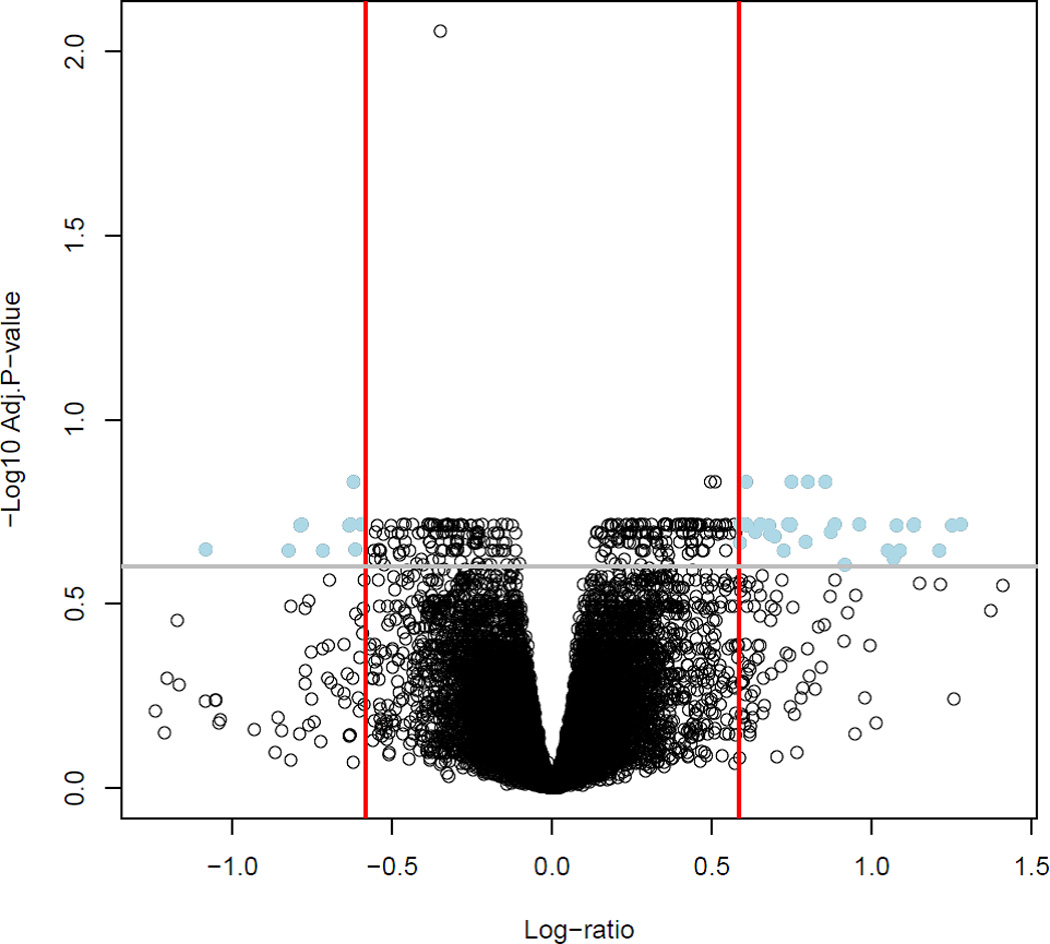
Figure 1. Microarray analysis of the gene expression profiles of myometrium in spontaneous term labor (TL) and arrest of dilatation (AODIL).

A Volcano plot shows differentially gene expression between AODIL and TL. Dots in the upper right and left quadrants represent genes with a fold change greater than 1.5 and a false discovery rate corrected p-value < 0.25. With these criteria, 42 genes were differentially expressed between the myometrial transcriptome of the two groups.
