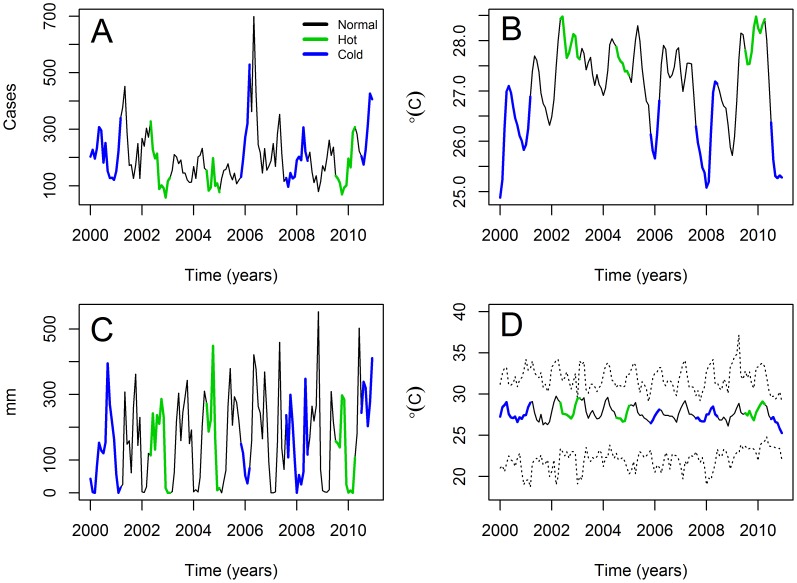
Figure 1. Monthly time series data (2000–2010).
(A) Cutaneous Leishmaniasis cases in the Republic of Panamá (B) Rainfall (C) Temperature. The solid line indicates the averages and dashed lines the extremes. (D) Sea Surface Temperature 4 (El Niño 4 Index). All time series start in January 2000 and end in December 2010. In the plots colors indicate the ENSO phase, for details refer to the inset legend in panel A.

