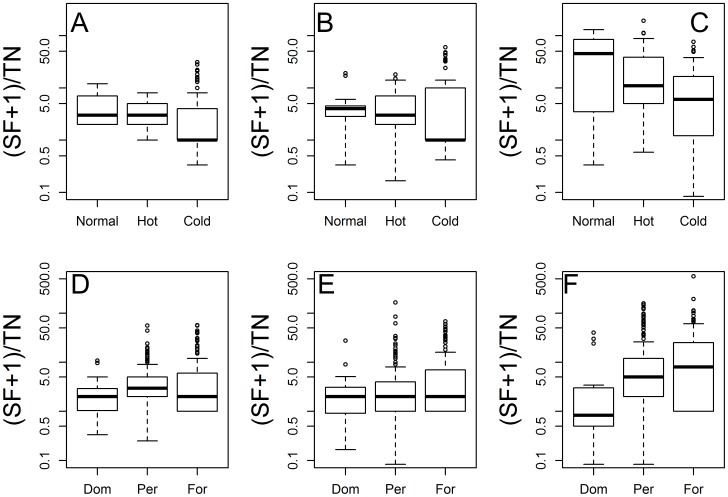
Figure 5. Sand Fly vector species abundance during the different ENSO phases and by eco-epidemiological environment.
Abundance by ENSO phase: (A) Lutzomyia gomezi (B) Lu trapidoi (C) Lu panamensis. Abundance by eco-epidemiological environment: (D) Lu gomezi (E) Lu trapidoi (F) Lu panamensis. Panels A, B and C show data only for April, October and November where the number of trap-nights was above 30. In all panels the y-axis is in a logarithmic scale.

