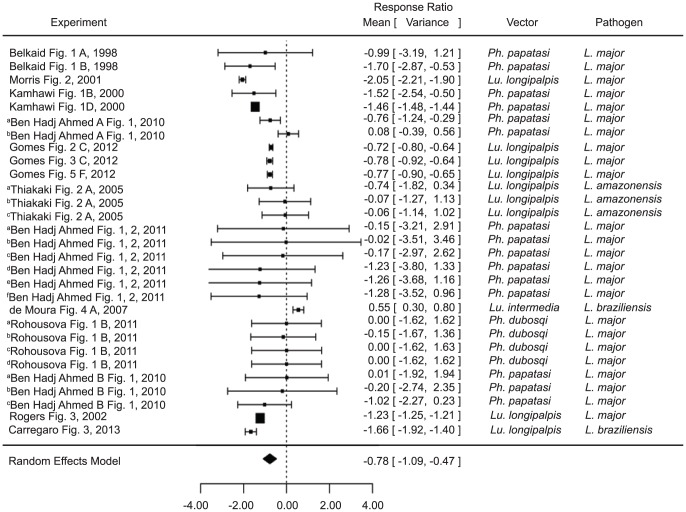
Figure 3. Forest plots of the relationship of exposure to vector saliva before infection and Leishmania lesion size (Category 2).
Symbols represent the mean response ratio of the individual studies (squares) and of the entire analysis (diamond) using a Random Effects Model; the size of the square is proportional to the weight of an individual study. Error bars represent 95% Confidence Interval (CI). Squares to the right of the dotted line indicate larger measurements in the experimental (pre-exposed) group, while those on the left indicate larger measurements in the control group. Those that cross the center indicate no significant difference.

