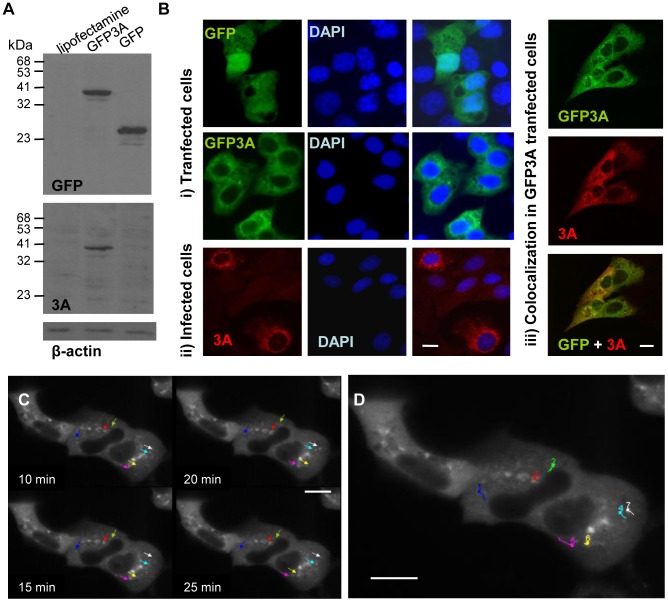
Figure 1. Expression of GFP3A and in vivo analyses of 3A protein in transfected cells.
A) Vero cells were transfected with 1 µg of pEGFP3A. Proteins were detected by Western blotting with a polyclonal Ab to 3A (479) or a MoAb to GFP as primary antibodies. Blotting to β-actin was used as control of protein loading. Molecular weights are indicated in kDa. B) Fluorescence microscopy of: i) Vero cells transiently expressing GFP or GFP3A; ii) IBRS cells 4 h pi with FMDV; iii) Vero cells transiently expressing GFP3A (24 h pt) incubated with a polyclonal Ab to 3A (346) (red) or showing the autofluorescence of GFP (green). Co-localization is shown in the merge image. Cell nuclei were counterstained with DAPI. C) For time-lapse microscopy, Vero cells were transfected with pEGFP3A and 6 h later cells were scanned by 488-line laser every 5 min for 3 h, as described in Materials and Methods. Images at different times are shown. Colored arrows point to selected tracked dots. D) Manual tracking of the fluorescence of selected dots was performed using ImageJ plug-in. Scale bar, 20 µm.

