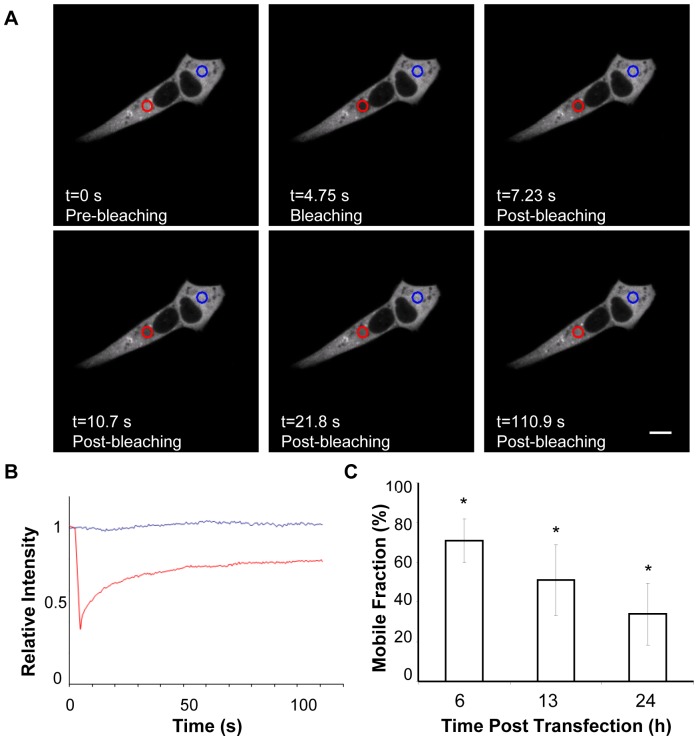
Figure 2. FRAP analysis.
Vero cells were transfected with pEGFP3A. A) Images of transfected cells pre bleaching, bleaching and post bleaching. At different times pt a ROI of 10 µm Ø circular region (red circle) was photobleached. Recovery of the fluorescence was monitored by continuous scanning the whole cell (including ROI). The area selected as control in the neighbor cell is indicated by a blue circle. Experiments were done in triplicate (n>10). B) Relative intensity vs. time in FRAP determined in (A). C) Percentages of the GFP3A mobile fraction, determined as described in Materials and Methods, at different times pt. Data are presented as means ± the standard deviations. An asterisk denotes statistically significant differences (P≤0.005). Scale bar, 20 µm.

