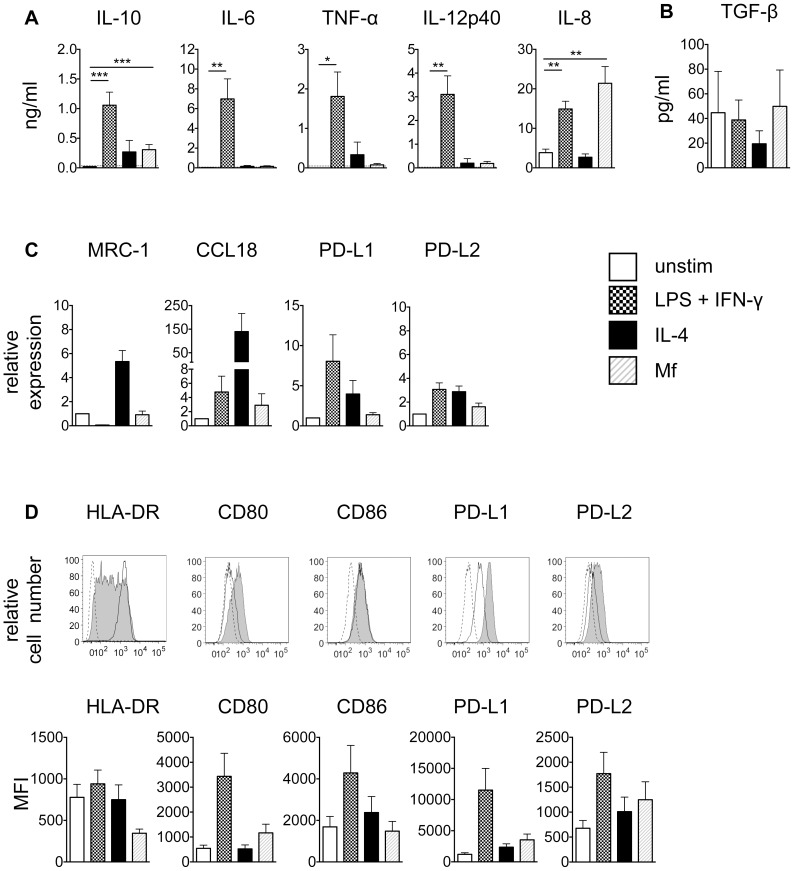
Figure 5. Macrophages stimulated in vitro with B. malayi Mf lysate develop a specific activation phenotype.
Macrophages were left unstimulated or stimulated for 24 h with 100 ng/ml LPS+20 ng/ml IFN-γ, 20 ng/ml IL-4 or 20 µg/ml Mf lysate. A) Cytokine production was measured using ELISA (pooled data from 4–6 experiments; n = 8–18). Horizontal dashed line indicates the limit of detection of the assay. B) Active TGF-β was measured using a TGF-β reporter assay (pooled data from 2 experiments; n = 6). C) mRNA expression was determined using RT-PCR (pooled data from 2 experiments; n = 6). D) Surface expression of HLA-DR, CD80, CD86, PD-L1 and PD-L2 was measured by flow cytometry. Upper panel, dashed line: FMO control; black line: unstimulated; solid grey: stimulated with Mf lysate. Lower panel, pooled data from 2 experiments (n = 6) are represented the mean fluorescence intensity (MFI). All data are represented as mean ± SEM. P values were calculated using the Wilcoxon signed-rank test. * p<0.0167, ** p<0.0033, *** p<0.0003.

