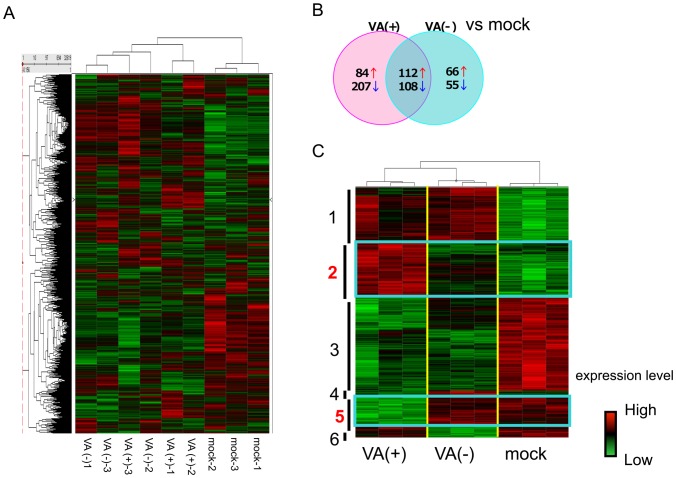
Figure 1. Microarray analysis.
Global gene expression analysis of AdV infected A549 cells by Affymetrix microarray. Cells were harvested and total RNA was isolated after 24 h after infection. (A) Hierarchical clustering analysis using 32,619 genes of which expression was determined as “Present” in GCOS software in every sample. (B) The numbers of up or down regulated genes compared with mock infected group (Fold change >1.5, P<0.01). Red arrow indicates the numbers of up-regulated genes, and blue arrow indicates the numbers of down-regulated genes. (C) Identification and isolation of VA (+) specific gene clusters by hierarchical clustering analysis. The numbers of target genes were 2,800 genes, which were selected by ANOVA analysis in advance.

