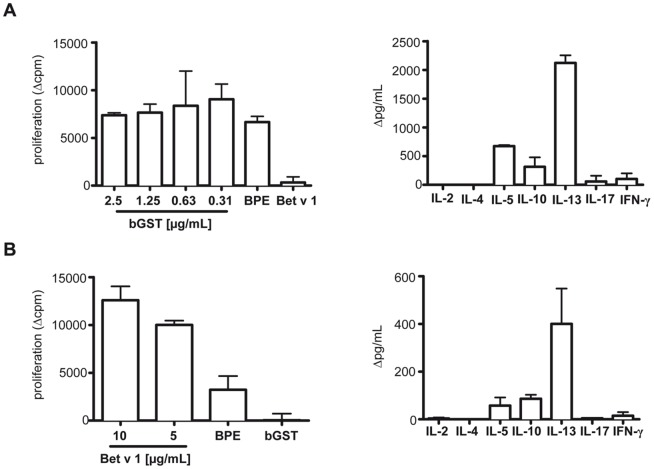
Figure 4. T cell responses to bGST and Bet v 1 in BALB/c mice.
(A) Proliferative and cytokine responses of splenocytes from mice immunized with bGST (n = 5) to titrated amounts of bGST, BPE (25 µg/mL) and Bet v 1 (5 µg/mL). Cytokines were induced with 1.25 µg/mL of bGST. (B) Proliferative and cytokine responses of splenocytes from mice immunized with Bet v 1 (n = 5) to Bet v 1, BPE (25 µg/mL) and bGST (1.25 µg/mL). Cytokines were induced with 5 µg/mL of Bet v 1. Δcpm, cpm of unstimulated cultures were subtracted from stimulated cultures (mean background cpm = 4724±742); Δpg/mL, levels in unstimulated cultures were subtracted from stimulated cultures (mean pg/mL of IFN-γ were <135 pg/ml and of remaining cytokines <20 pg/ml).

