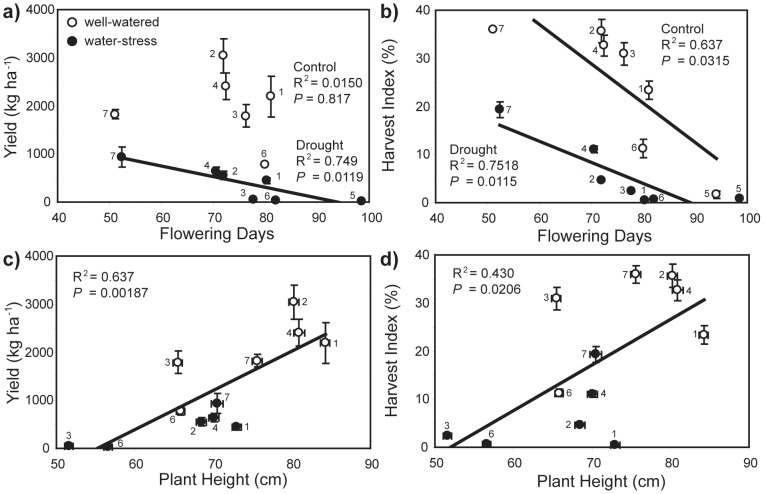
Figure 1. The performance of seven rice varieties under well-watered (open symbols) and drought conditions (closed symbols): a) relationship between yield and flowering days (period of time for 50% of plants to develop flowers) under full-water (linear regression: R2 = 0.0150; F 1,4 = 0.0609; P = 0.817) and drought (linear regression: R2 = 0.749; F 1,5 = 14.905; P = 0.0119); b) allometric relationship between yield and plant height (linear regression: R2 = 0.637; F 1,10 = 17.536; P = 0.00187); c) relationship between harvest index (HI:dry weight of grain relative to dry total plant biomass) and flowering days under full-water (linear regression: R2 = 0.637; F 1,5 = 8.760; P = 0.0315) and drought (linear regression: R2 = 0.752; F 1,5 = 15.144; P = 0.0115), and; d) relationship between HI and plant height (linear regression: R2 = 0.430; F 1,10 = 7.548; P = 0.0206).
Error bars indicate one standard error either side of the mean. Numbers next to data points indicate Oryza sativa variety: 1 = Apo; 2 = IR55; 3 = IR64; 4 = IR71; 5 = Moro; 6 = PSBRc80; 7 = Van.

