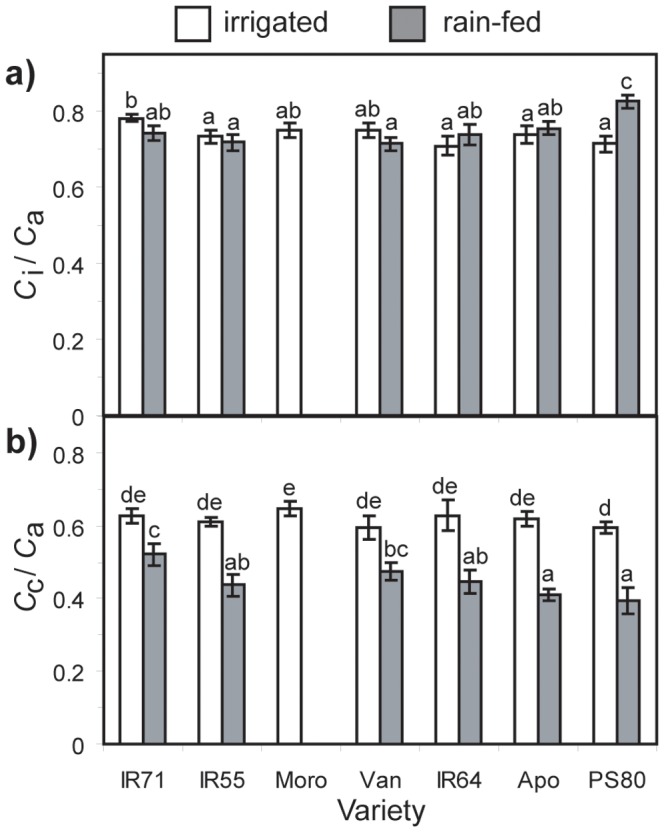
Figure 4. Measurements of (a) the intercellular [CO2] (C i) to the ambient [CO2] (C a) ratio (C i/C a), and (b) the chloroplastic [CO2] (C c) to the ambient [CO2] ratio (C c/C a) in control and water-stressed leaves of the seven Oryza sativa genotypes.

The measurements were made on the flag leaf in saturating PPFD (1400 µmol m−2s−1), with relative humidity ranging between 45–55%, and a leaf temperature of 30°C. Data are means of 4 to 7 plants per treatment. Error bars as in Figure 1. Different letters denote significant differences among means derived using a factorial ANOVA and Tukey post-hoc test.
