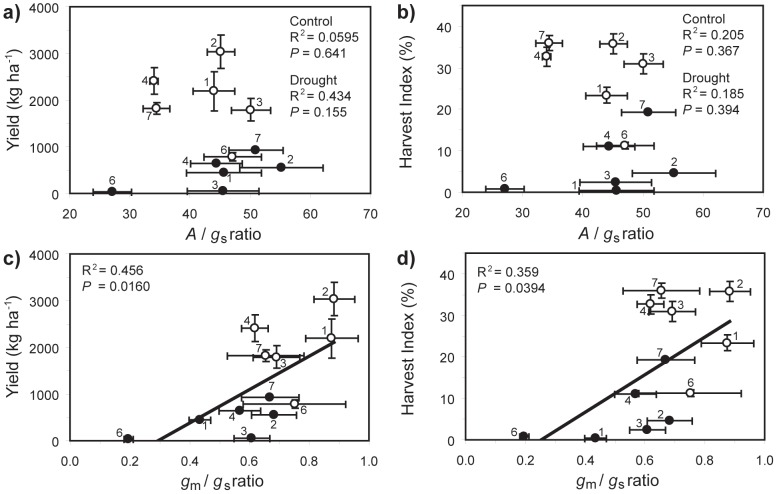
Figure 7. Interaction of yield and A with transpiration efficiency (A/g s) and the ratio of g m to g s in well-watered (open symbols) and drought conditions (closed symbols): a) relationship between yield and A/g s under full (linear regression: R2 = 0.0595; F 1,4 = 0.253; P = 0.641) and water-stressed (linear regression: R2 = 0.434; F 1,4 = 3.072; P = 0.155) conditions; b) relationship between harvest index (HI) and A/g s under full (linear regression: R2 = 0.205; F 1,4 = 1.032; P = 0.367) and water-stressed (linear regression: R2 = 0.185; F 1,4 = 0.909; P = 0.394) conditions; c) relationship between yield and g m:g s (linear regression: R2 = 0.456; F 1,10 = 8.379; P = 0.0160), and; d) relationship between HI and g m:g s (linear regression: R2 = 0.359; F 1,10 = 5.610; P = 0.0394).
Error bars as in Figure 1. Numbers next to data points indicate Oryza sativa variety as in Figure 1.

