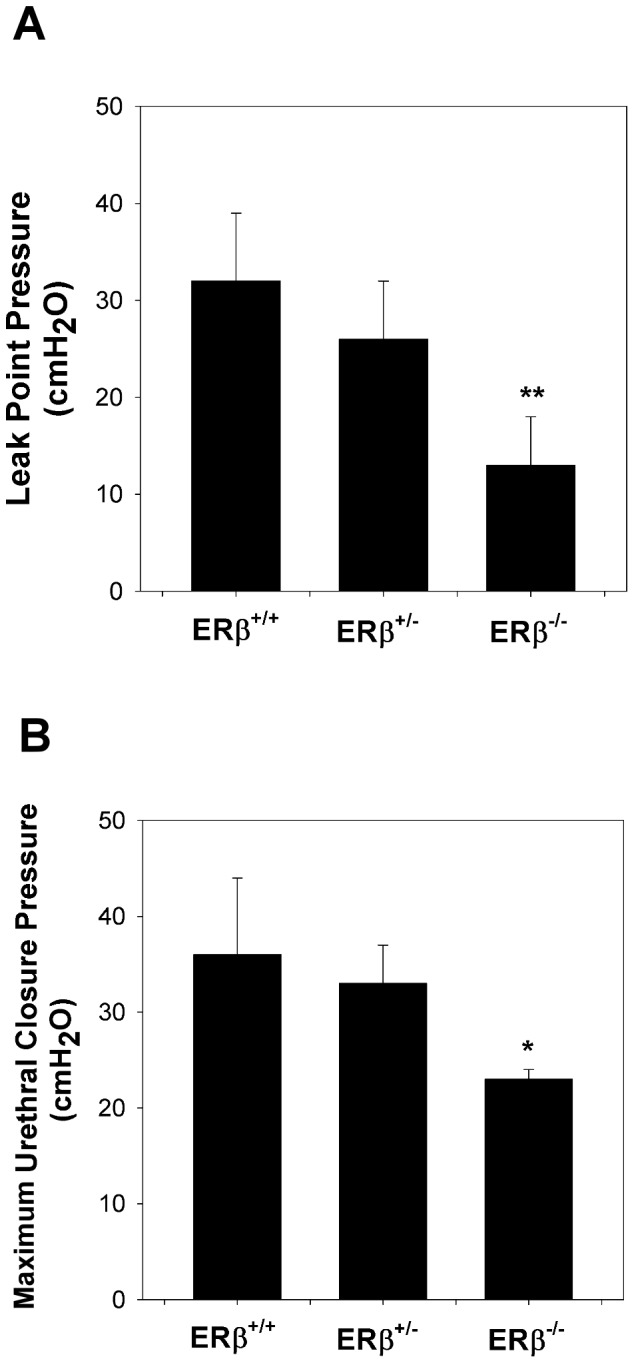
Figure 2. Decreased urodynamic testing in ERβ−/− mice.

(A) LPP and (B) MUCP values in the different groups. Each bar represents the mean ± standard deviation of six individual mice. *P<0.05 different from the value in the control group. **P<0.01 different from the value in the control group.
