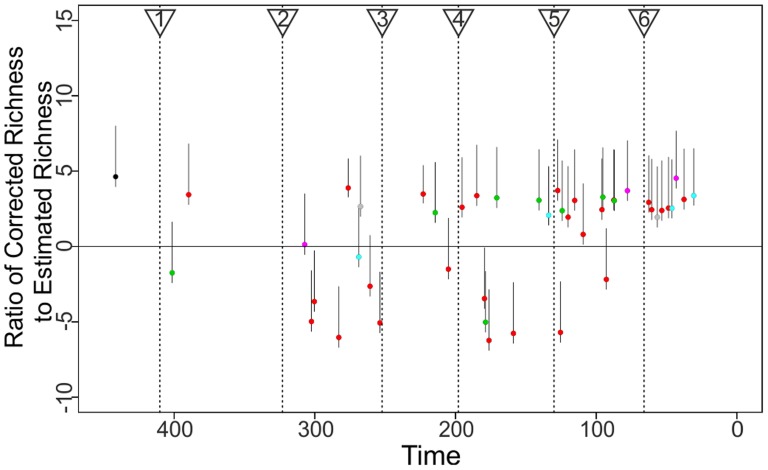
Figure 3. Change in species richness associated with shift events plotted through time.
Values plotted show the ratios between the observed richness of the clade (after correction for nested shifts) and the mean estimated values of the richness of a clade of the appropriate age under the parental diversification model (see main text and Supplementary materials). Confidence intervals given are based on the change in richness associated with 95% CIs on the estimated outcomes of the stochastic diversification process. See also Table S3.

