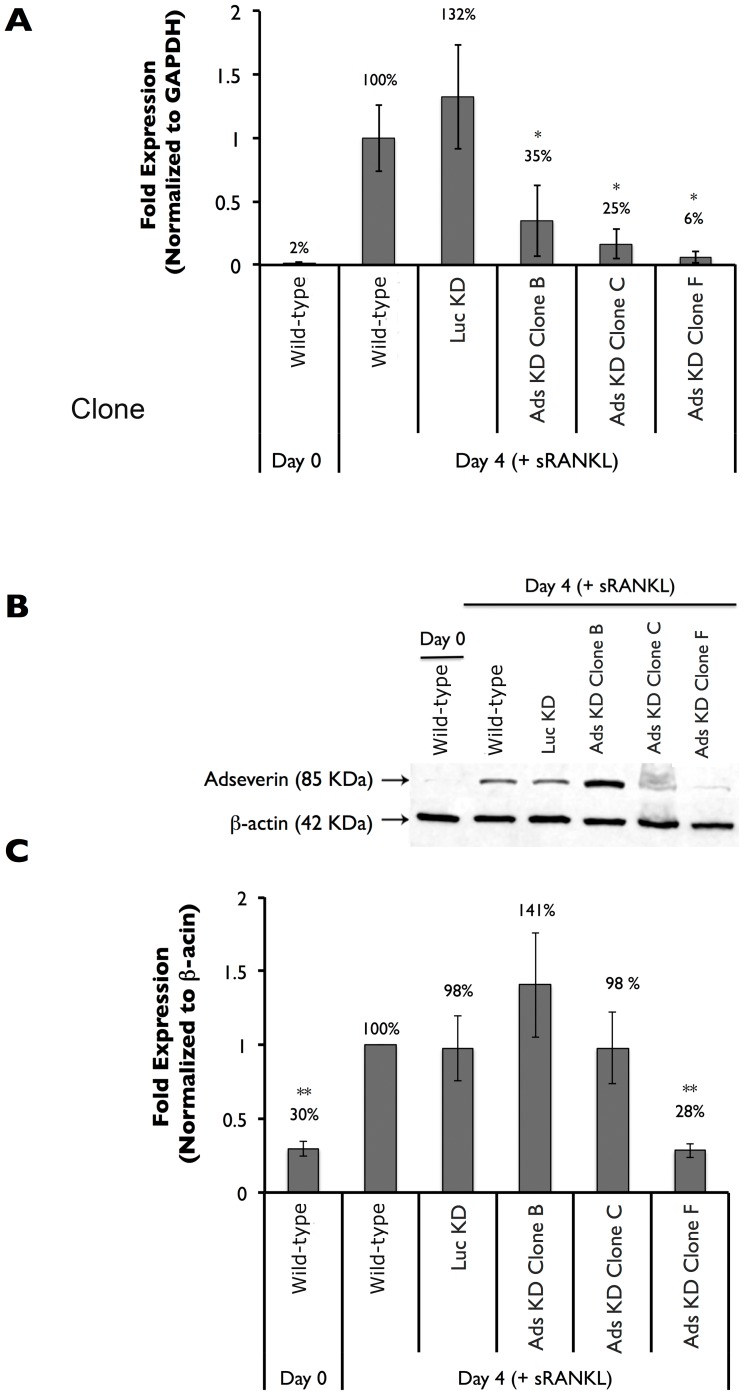
Figure 4. Adseverin knockdown clonal cell lines displayed varying degrees of Adseverin attenuation in response to sRANKL.
A) Quantitative real-time PCR was used to quantify Ads gene expression in Day 0 and Day 4 osteoclast cultures. Results are expressed as fold expression versus WT Day 4 and are normalized against GAPDH ± SEM. Ads gene expression was not significantly different between Day 4 WT and Luc KD cultures. Ads transcript levels were significantly lower in all three Ads KD cell lines. Ads gene expression in Clones B and C were 35% and 25% that of Day 4 WT cultures, respectively. Ads KD Clone F cultures experienced the greatest reduction in Ads gene expression. Transcript levels in Day 4 Ads KD Clone F were similar to Day 0 WT cultures, which translated to 6% of Day 4 WT expression. B) Immunoblotting was used to quantify Ads protein expression in Day 0 and Day 4 osteoclast cultures. C) Results are quantified and expressed as fold expression versus WT Day 4 (±SD) and are normalized against β-actin. Ads protein expression was not significantly different between Day 4 WT, Luc KD, and Ads KD Clone B and C cultures. Ads KD Clone F cultures experienced the greatest reduction in Ads expression. Protein levels in Day 4 Ads KD Clone F were similar to Day 0 WT cultures, which translated to 28% of Day 4 WT expression (**p<0.01, n = 4).

